Why Your SA Business is Flying Blind Without Denominator Data

In the fast-paced, hyper-competitive world of South African business, data without context is like scoring 50 marks without knowing it’s out of 200 – a recipe for poor decisions. Enter denominator data: a game-changing approach to geospatial insights that provides the missing “total” for your numbers, turning raw sales values (or risk, calls, etc.) into meaningful intel – steering action.
Denominator data South Africa

Remember that awkward school chat?

A: You pass your year?

B: I got 50 marks.

A: Yes, but 50 marks out of how many?

B: 200.

A: Ouch, that’s a bad fail.

We all laughed it off as kids, but fast-forward to running a business in South Africa, and it’s no joke. Context is everything. Without context, your data is just a number floating in the void – impressive on paper, useless in practice.

In the world of strategic decisions, benchmarks are great. But the real game-changer? Knowing the “total size of the prize.” That’s where fractions come in – remember them from primary school? One number (your numerator) over another (the denominator).

All SA businesses know their numerators cold – be it sales figures, risk exposure, asset values, power numbers, call-outs, or even vehicles on the road. But the denominator? The “out of what?” That’s often MIA. What’s your share of the total market? How do you stack up against competitors? Without it, you’re guessing, not deciding.

Enter denominator data – a fresh paradigm in geospatial insights. It’s simple: total values for a specific area, geo-coded and ready to go to work for you. Let’s break it down with a real-world example tailored to our rainbow nation’s provinces.

We show you what works, and what doesn’t – and explain what you need.

The classic trap: numerator-only maps

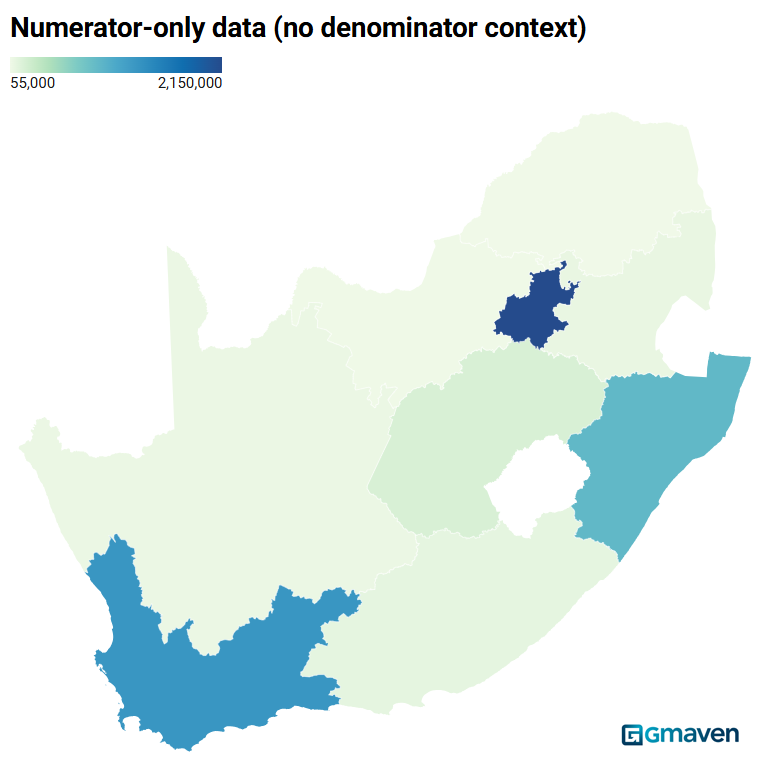
Imagine Company A raking in 5 million beans of sales (beans could be bucks, policies, or widgets – you get it). They’ve mapped these to South Africa’s nine provinces. Boom: A choropleth map showing Gauteng dominating, with Western Cape and KZN trailing.

Numerator-only data South Africa

(Here, sales locations are assigned to SA’s 9 provinces. Gauteng has the most sales because it has the most people and commerce – for now. Western Cape and KZN follow. No surprises.)

Yawn. Decision-makers already know their sales numbers. Gauteng’s on top? Shocker – it’s the economic heartbeat. But so what? This map tells you nothing about performance. It’s like bragging about 50 marks without mentioning the 200 total.

What leaders really crave: Sales vs. what? What’s the total market opportunity? Which provinces are punching above their weight, and which are slacking?

The magic happens when you add the denominator

To unlock real insights, you need two things:

  1. Crystal-clear geospatial boundaries. Compare apples to apples – your sales data must align perfectly with the area definitions. No mixing Western Cape sales with Gauteng’s population; that’s a recipe for rubbish.
  2. Relevant denominators. For B2B plays, try tenanted gross lettable area as a proxy for commercial activity. For B2C, population works, but segment it by consumer spending power specific to your product? Gold.

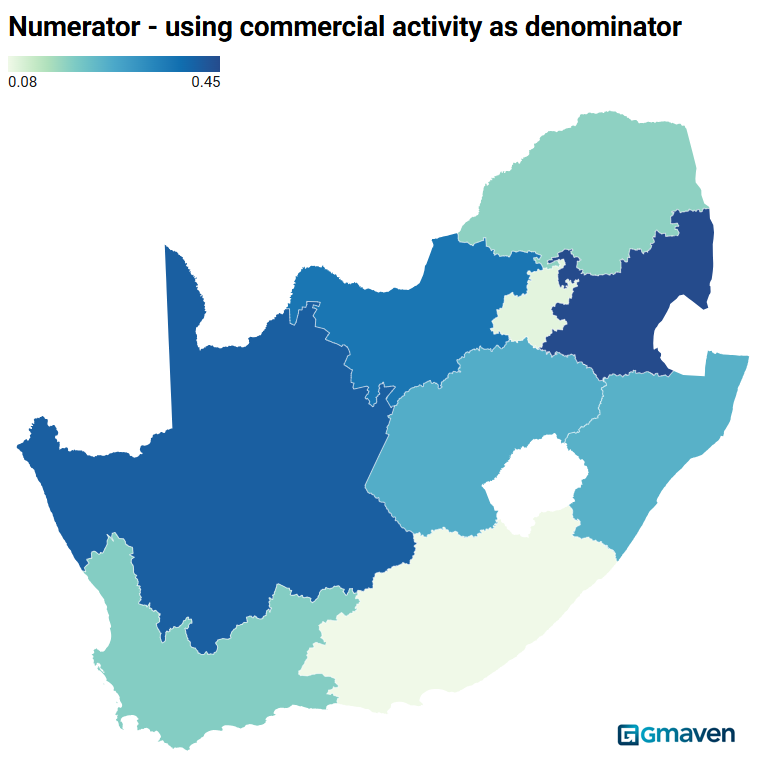
Apply that to the same sales data, and watch the transformation. Now you’re looking at ratios – your numerator divided by a meaningful total.

Denominator data South Africa - commercial activity

(Same numerator data, but now ratio-ed per province. Notice the shift?)

Suddenly, the story flips. Mpumalanga’s team is crushing it. Northern Cape and North West? Solid performers relative to the pack. But Gauteng and Eastern Cape? Red flags waving. These are your problem spots.

Where do you deploy more front office resources? Ramp up marketing? Fix or activate channels? The answers jump off the page. No more gut feels; pure, actionable intel.

Going deeper: beyond provinces for richer wins

Provinces are just the start – the least granular layer. Dive deep into MECE (mutually exclusive, collectively exhaustive) levels like commercial nodes or suburbs. Or craft your own custom areas. Geospatial is flexible, powerful, and tailored to SA’s unique landscape.

All you need: Your geo-coded data, relevant denominator data sets (geo-coded too), and solid area definitions. Connect the pieces, and your data starts working for you, not against you.

The denominator data dud: what not to do

Relevant, reliable, complete denominator data is tough to get.

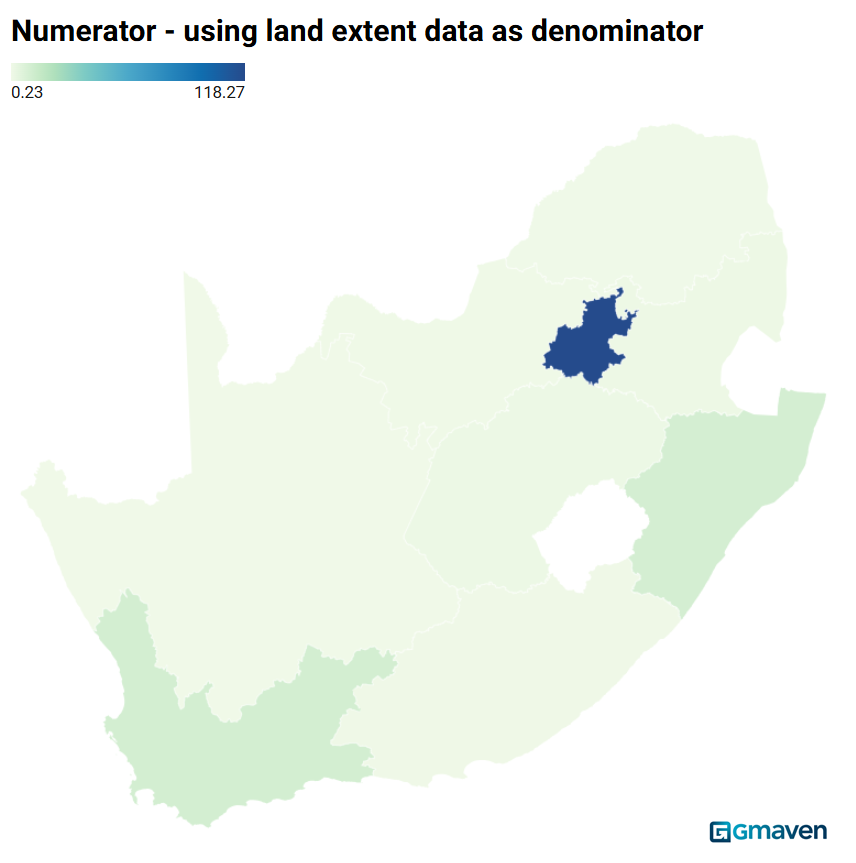
Pro tip: Pick the wrong denominator, and it’s worse than nothing. Take land extent – SA’s vast, empty spaces skew everything.

Invalid denominator data

(Numerator divided by land area. Useless for business – unless you’re selling to deserts.)

See? Gauteng looks tiny because it’s dense, not because it’s underperforming. Meaningless metrics lead to misguided moves. Stick to relevant proxies like commercial activity or targeted demographics.

Similarly, get your area definitions (aka polygons) wrong, and you’re going to pollute your data. Sandton, while close to Alexandra township, distorts your demographic data.

Level up your SA strategy today

In a market as nuanced and dynamic as South Africa’s – with historical spatial planning and evolving urban areas, service delivery curveballs, economic shifts, and fierce competition – denominator data isn’t a nice-to-have. It’s your edge. Stop staring at half the picture. Add context, uncover opportunities, and make decisions that stick.

Ready to denominator-ize your data? At Gmaven, we’ve got the simple geospatial tools and datasets to make it happen. We can turn your numbers into narratives that drive growth.

Thank you to Michael Wedgwood for geeking out on this denominator data concept, and sharing this article.
Thank you to Datawrapper for the awesome visualisation software.
Final point. Think of geospatial as a common language (Esperanto) that allows different data sets to sing together. This makes it immensely powerful, but also accessible.

About the author

Related posts

Industry Intel and News
AI Boosts Business: A Joe’s Journey

Over 40 and feeling the AI heat? Is it hype or hope? As a regular SA Joe with pretty good Excel and BA basics, I dove in to AI, tackling a real problem you likely wrestle with every day – moving raw data to useful output. Forget the 6 week old ways “black box”, I built a game-changer in 15 days. Join me as I share the wins, woes, and wisdom of my journey – proof you can too.


SA commercial property value
Industry Intel and News
Latest SA commercial property value

This is a key number in South African commercial real estate (CRE). After a lot of hard work, we are able to deliver a firm, defensible value to SA – relevant to businesses (who almost all operate out of CRE), policy makers and the industry itself.

Solar for CRE
Industry Intel and News
Solar for commercial real estate

For a South African CRE industry buffeted by Covid, weak economic growth and public sector incompetence, is solar power too good to be true? Is solar indeed one of property’s unicorns – a positively geared investment with increasing cash flows – and what are the risks associated with it?

Leave a Reply

Your email address will not be published. Required fields are marked *

Fill out this field
Fill out this field
Please enter a valid email address.
You need to agree with the terms to proceed