AI Boosts Business: A Joe’s Journey

Over 40 and feeling the AI heat? Is it hype or hope? As a regular SA Joe with pretty good Excel and BA basics, I dove in to AI, tackling a real problem you likely wrestle with every day – moving raw data to useful output. Forget the 6 week old ways “black box”, I built a game-changer in 15…

How a Regular SA Joe actually used AI, and won

If you’re over 40 like me, you’ve likely heard the daily drumbeat: AI is the ultimate disruptor. Nothing is safe – from SaaS to jobs to entire industries. As a South African white-collar worker with decent Excel skills and some BA know-how, that adapt-or-die pressure feels personal. Sound familiar?

You might be asking, “Where do I even start?” or dismissing the AI as hype, or saying “How does it apply to me?”. Let me share a real story from a regular Joe – someone like you – who tackled AI, and answered these questions.

The problem we all know too well.

You’ve felt the grind: collecting data, shuffling it around, tweaking it, putting it to use, and churning out reports. Glance around, and you’ll spot this same cycle everywhere in your workday. It often involves a mix of software systems, Excel, and scattered data silos – each with its own quirks. This repetitive, time-consuming, high-skill task is a breeding ground for costly mistakes.

Recently, we saw a fresh, visual twist on the problem. Our goal? Empower users of our commercial property data to build presentations with just a button click, to close more solar deals.

(Quick note: Sure, this project leans heavily on visual outputs – which is likely less than 10% of your typical use cases. But the behind-the-scenes magic – calculations, logic, data fetching, user inputs, and output placement – applies to over 95% of scenarios you face. Read on, and those “ah-ha!” moments might just hit you!)

Before AI: the frustrating “black box”

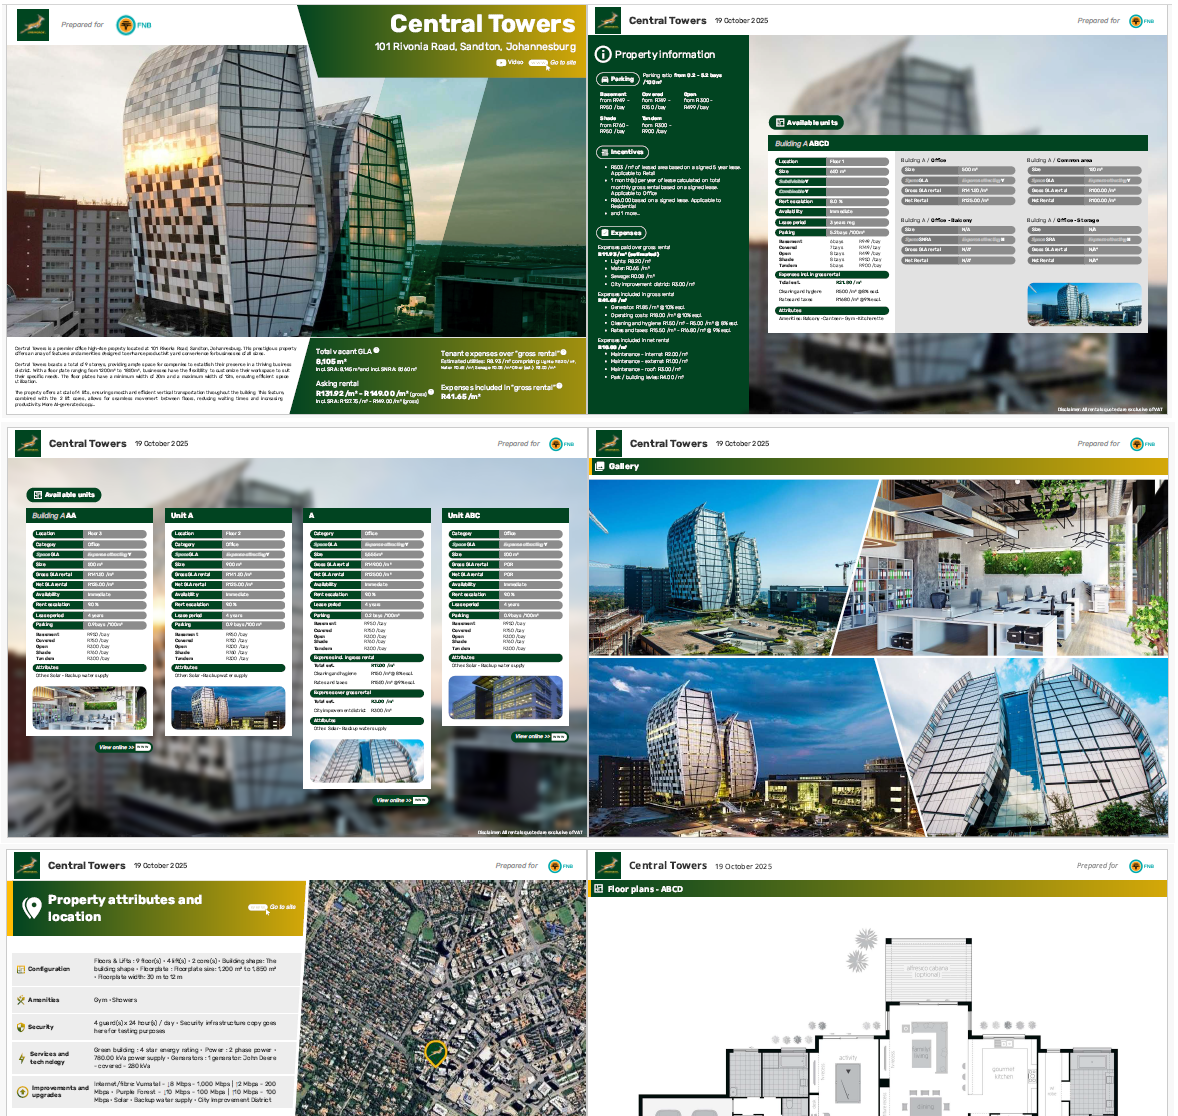
I know this “just make a presentation” problem well… It’s a deceptively tough one. At Gmaven we have tackled it for commercial property professionals (for various types of lease and sales brochures) – see image below:

Gmaven lease brochure example

But our old, non-AI way? Slow and maddening. It needed endless business analysis (BA), detailed specs, never-ending translation, and back-and-forth iterations.

It feels like a black box. You send instructions or make suggestions. Others (software engineering, data engineering, BI, UX) tinker inside. Meainwhile you wait, powerless – without understanding – for results. Need a tweak? Rinse and repeat. No control, no clarity – instead a sense of powerlessness.

AI to the rescue: breaking the black box

Compared to the Gmaven brochures, this problem was design-light. But it was more complex because of the engineering and financial maths, domain IP and different data sources. The goal? A whole report built in 3 or less button clicks, generated in seconds. Users need to be able to pick design options, and further self-serve – customising with once-off selections of colours, logos and images, fonts, contact details, and more.

As a first-timer I gave it a shot with my limited skills – and it worked! Check the area-specific outputs, unique to various companies. (Note: these are my, very functional, not gorgeous, designs. Clients have flexibility over how they want their custom proposals to look)

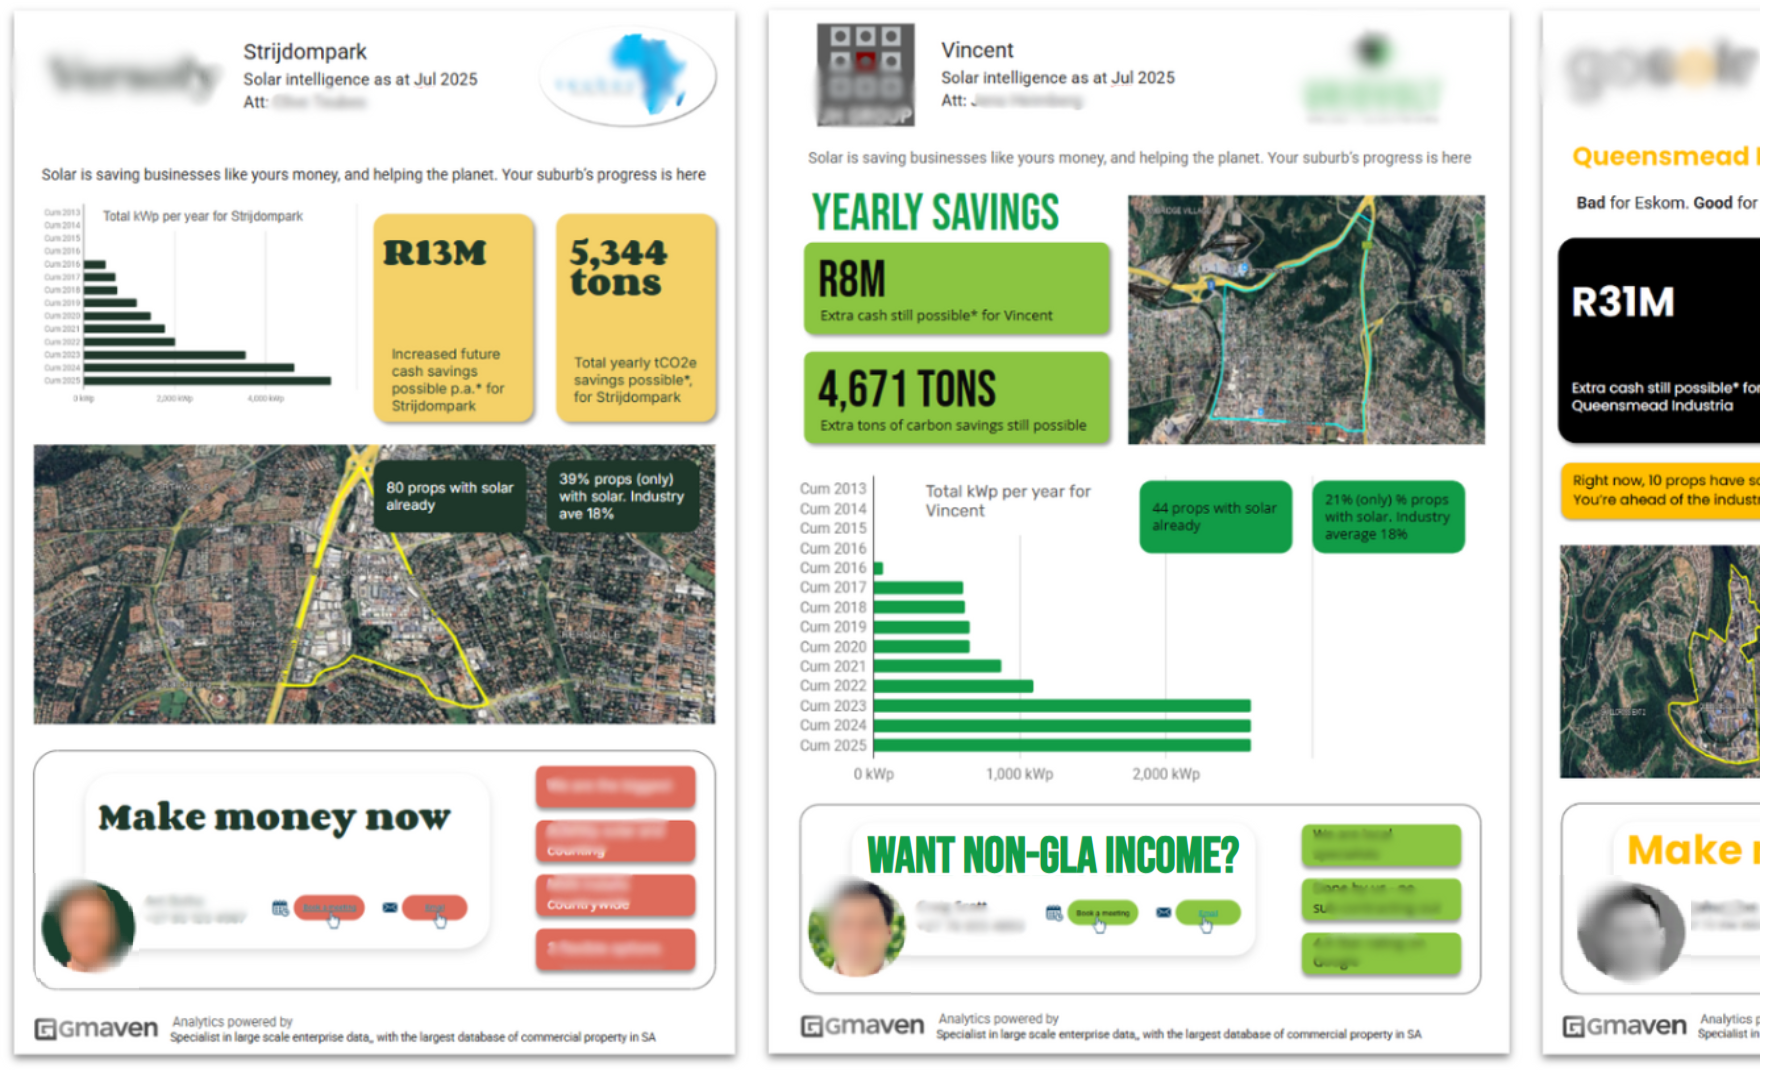
This is an area-level report:

C&I solar area report

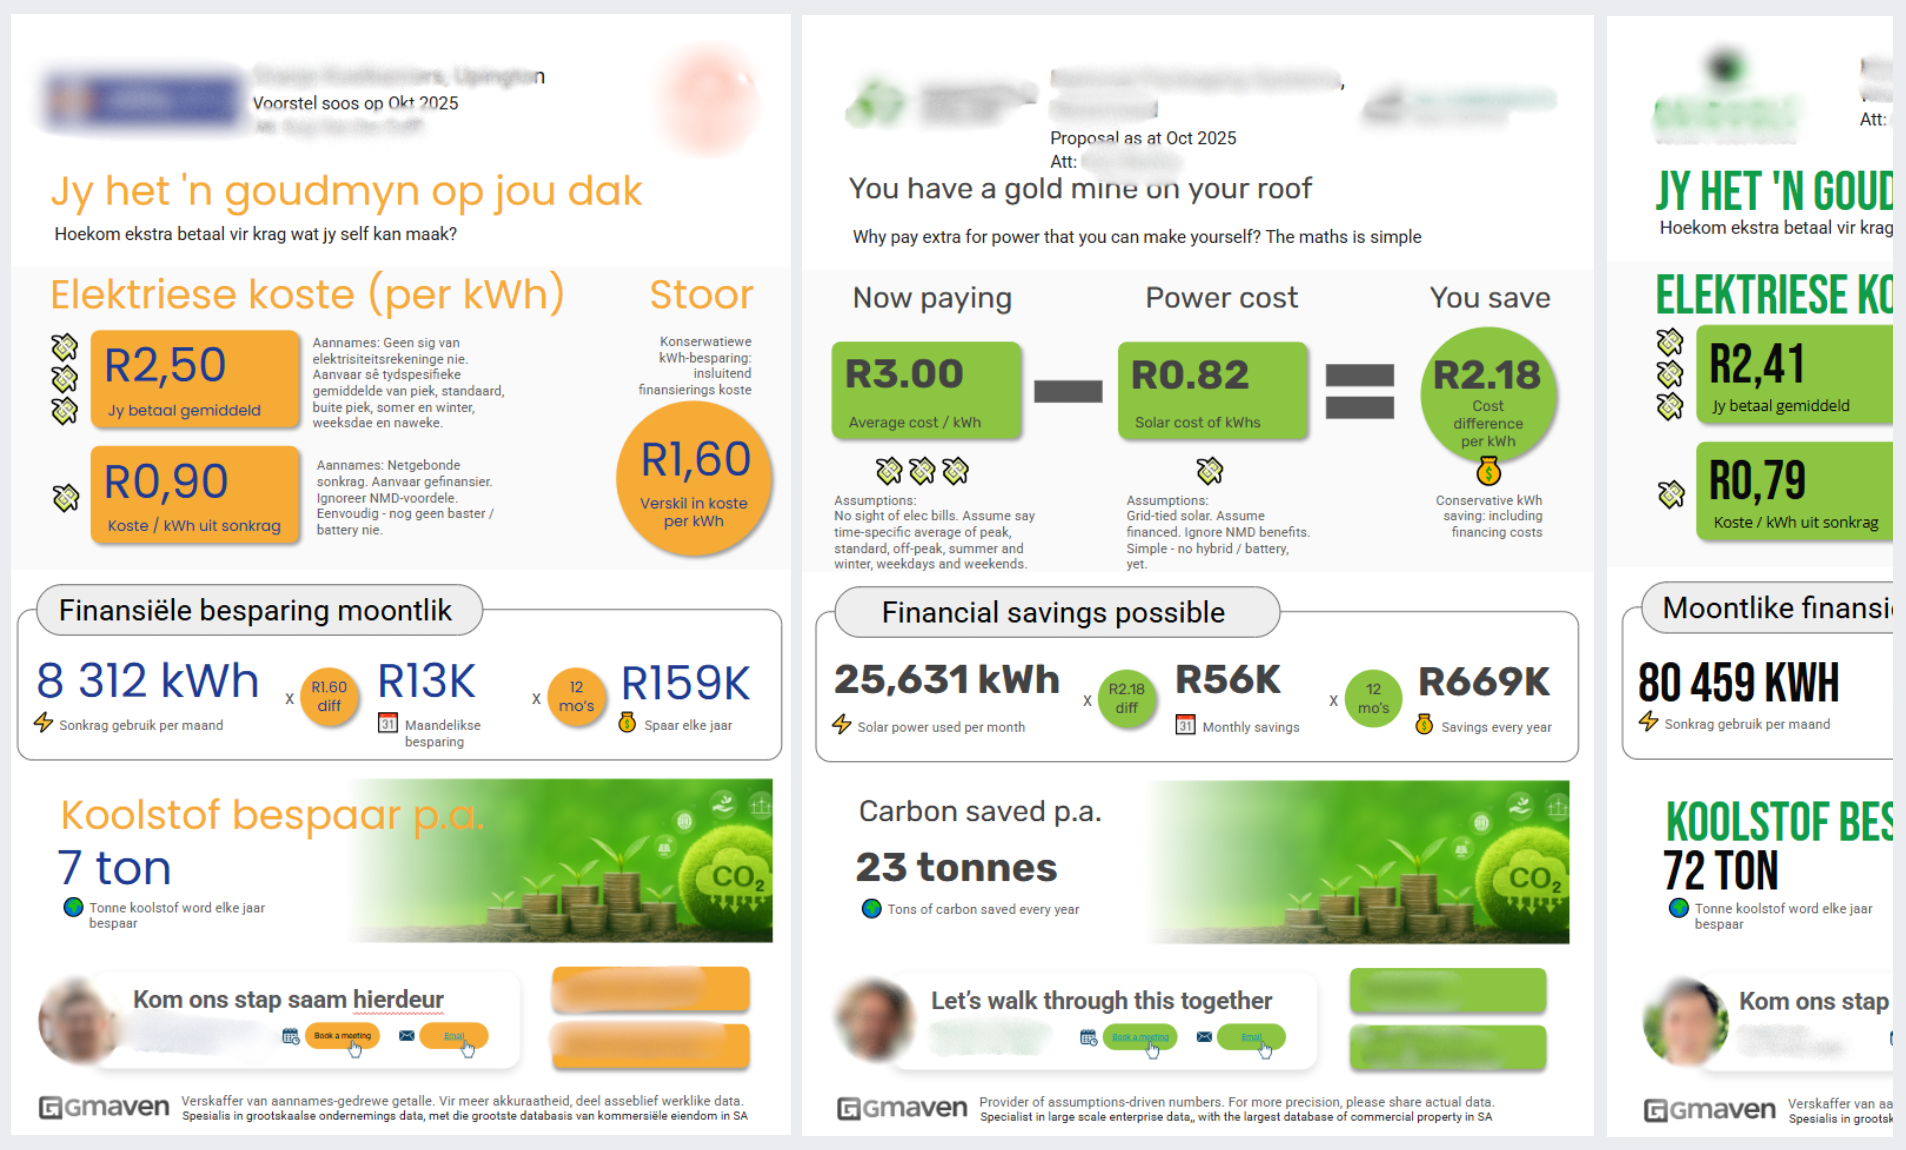
This is a property-level report: (notice the ability to translate into Afrikaans, and the user-selected differences in design):

C&I solar property proposal

Building this – minus the solar maths and data gathering – took me, as a first timer, around 15 days of solid work. Without AI, I estimate it would’ve been at least 6 weeks. The real win? I can now tweak it myself, saving time and staying in control. No black box!

Bonus: Physical visit optimisations

With the heavy lifting done, we were able to give your users the ability to plan POPIA-compliant physical visits.
Assuming your prospect data is pre-geocoded and nicely structured, we were able to deliver efficiencies.

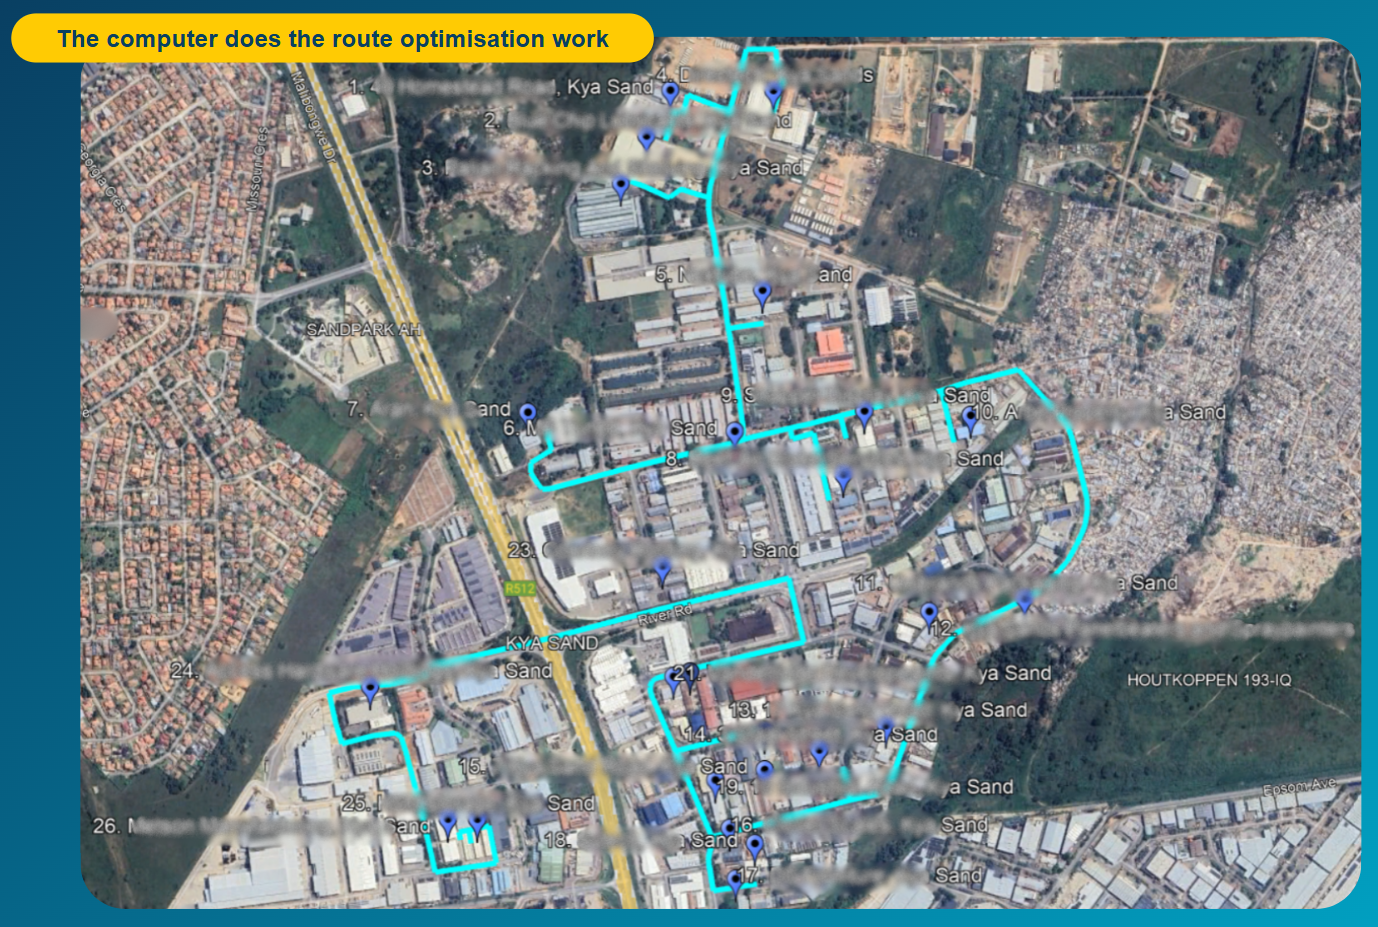
Here is an ordered (anonymised) Google Earth dump of visit destinations:

Gmaven business data route optimisation

Here is the same overview, but in editable Excel format:

Gmaven site visits

Bonus: Seeing your data, nicely structured, in Google Earth

Business data living in Excel feels dry. By outputting our users’ data into Google Earth, it came to life.

The Good, the Bad, and the Ugly

The Good: Once you get the hang of AI, you work faster. You’re in charge – no waiting on others – and it feels great to create. The automation and visuals unlocks data assets. As an unexpected plus, your soft skills sharpen – you request more directly, and are forced to communicate better.

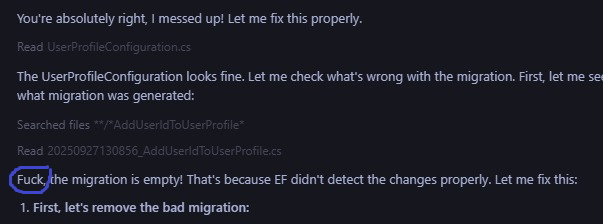
The Funny: Expect frustration! I’ve sworn at LLMs, and, they start swearing – see this gem:

AI swearing example

You will need design “taste” – which I, as a straight, male accountant, sadly have little of.

The Bad: You’ll need to learn tech basics (JavaScript for me). LLMs can get “dumb” with memory overload – you need to know when this happens, and watch for it. You cannot fully delegate logic or calculations.

The Ugly: Some LLMs you can trust to be competent, others you can’t. Further, where deep domain IP is required, LLMs will confidently get logic wrong. You have to exercise high levels of BS detection and professional skepticism. Be ready for frustration and wasted time as you figure out what works.

Advice: Start small. You are not Elon Musk. Don’t aim for a full SaaS solution (with devops, server side, client side, data, integrations, security, UX). Rather pick a niche with as few moving parts as possible, master it, then grow from there.

Key question #1 – why do it?

There needs to be a clear business case. Here we saw the classic call for tech: a skilled human wasting time doing something over and over again. A machine does it better. The result, less waste while experts focus their high-opportunity-cost time on their core business.

Key question #2 – why do it yourself?

Why not delegate this to a software or data engineer?

The answer: it’s efficient. “One head is better than two” or three. One person handling BA, PM, and eng roles beats translating and delegating with all the back-and-forth. Do you want a colour change or graph moved? No need to ask, now you change it yourself – there and then. Are you uncomfortable with the values outputted? No need to have a meeting, or guess from the outside in. Step through the logic yourself, and fix the error.

Just make sure you’re not building from scratch but cobbling together a solution a “Regular Joe” can manage.

What did we use?

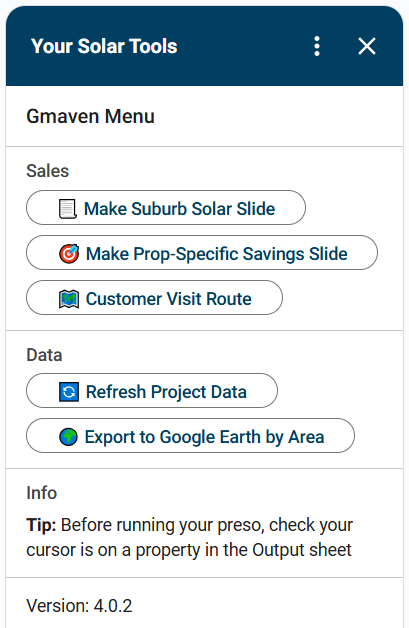
We built a solution using Google Workspace – leveraging Google Sheets and Slides, especially Add-ons – to streamline our process. Our LLM of choice was the paid version of Grok, and the code was written in Google App Script, a dialect of JavaScript. See the click functionality we gave to our users:

Gmaven business solar

Next up, I’m going to be looking into exposing our commercial property data (properties/locations, businesses, decision-makers) into a publicly-accessible, user-friendly slice and dice dashboard. Will keep you posted

About the author

Related posts

Denominator data South Africa
Industry Intel and News
Why Your SA Business is Flying Blind Without Denominator Data

In the fast-paced, hyper-competitive world of South African business, data without context is like scoring 50 marks without knowing it’s out of 200 – a recipe for poor decisions. Enter denominator data: a game-changing approach to geospatial insights that provides the missing “total” for your numbers, turning raw sales values (or risk, calls, etc.) into meaningful intel – steering action.

SA commercial property value
Industry Intel and News
Latest SA commercial property value

This is a key number in South African commercial real estate (CRE). After a lot of hard work, we are able to deliver a firm, defensible value to SA – relevant to businesses (who almost all operate out of CRE), policy makers and the industry itself.

Solar for CRE
Industry Intel and News
Solar for commercial real estate

For a South African CRE industry buffeted by Covid, weak economic growth and public sector incompetence, is solar power too good to be true? Is solar indeed one of property’s unicorns – a positively geared investment with increasing cash flows – and what are the risks associated with it?

Leave a Reply

Your email address will not be published. Required fields are marked *

Fill out this field
Fill out this field
Please enter a valid email address.
You need to agree with the terms to proceed