
Johannesburg commercial property: the R200 billion discount

The opinion is that Johannesburg property is undervaled. What does the data say? Where is the value trapped? Gmaven data on 25,700 properties and 1,100 deals post 2020 points to the opportunities within this c.R400B market – comprising over one fifth of the SA commercial real estate industry’s rentable area.
CRE Johannesburg market study

Prime Sandton offices are changing hands for less than it costs to build a suburban house. The market has put a price on broken local government, and an election in November could hand Johannesburg commercial property owners a windfall for doing nothing.

Here is a deal worth pausing on. Capitec has just bought itself a new head office: the Discovery building on Fredman Drive in central Sandton, diagonally across from the Industrial Development Corporation. It is 21,946 square metres of generously parked, A-grade office space, near the top of the industry’s quality scale. The price? R245 million, which works out at R11,164 per square metre, parking bays included.

Now hold that number up against ordinary building work. A family house in Johannesburg, at a finish most readers would recognise, runs from R18,000 to R25,000 per square metre before the land, and excluding basement parking bays. Read that again: one of South Africa’s largest banks has paid less per square metre for a prime Sandton tower than you would pay a builder in the suburbs.

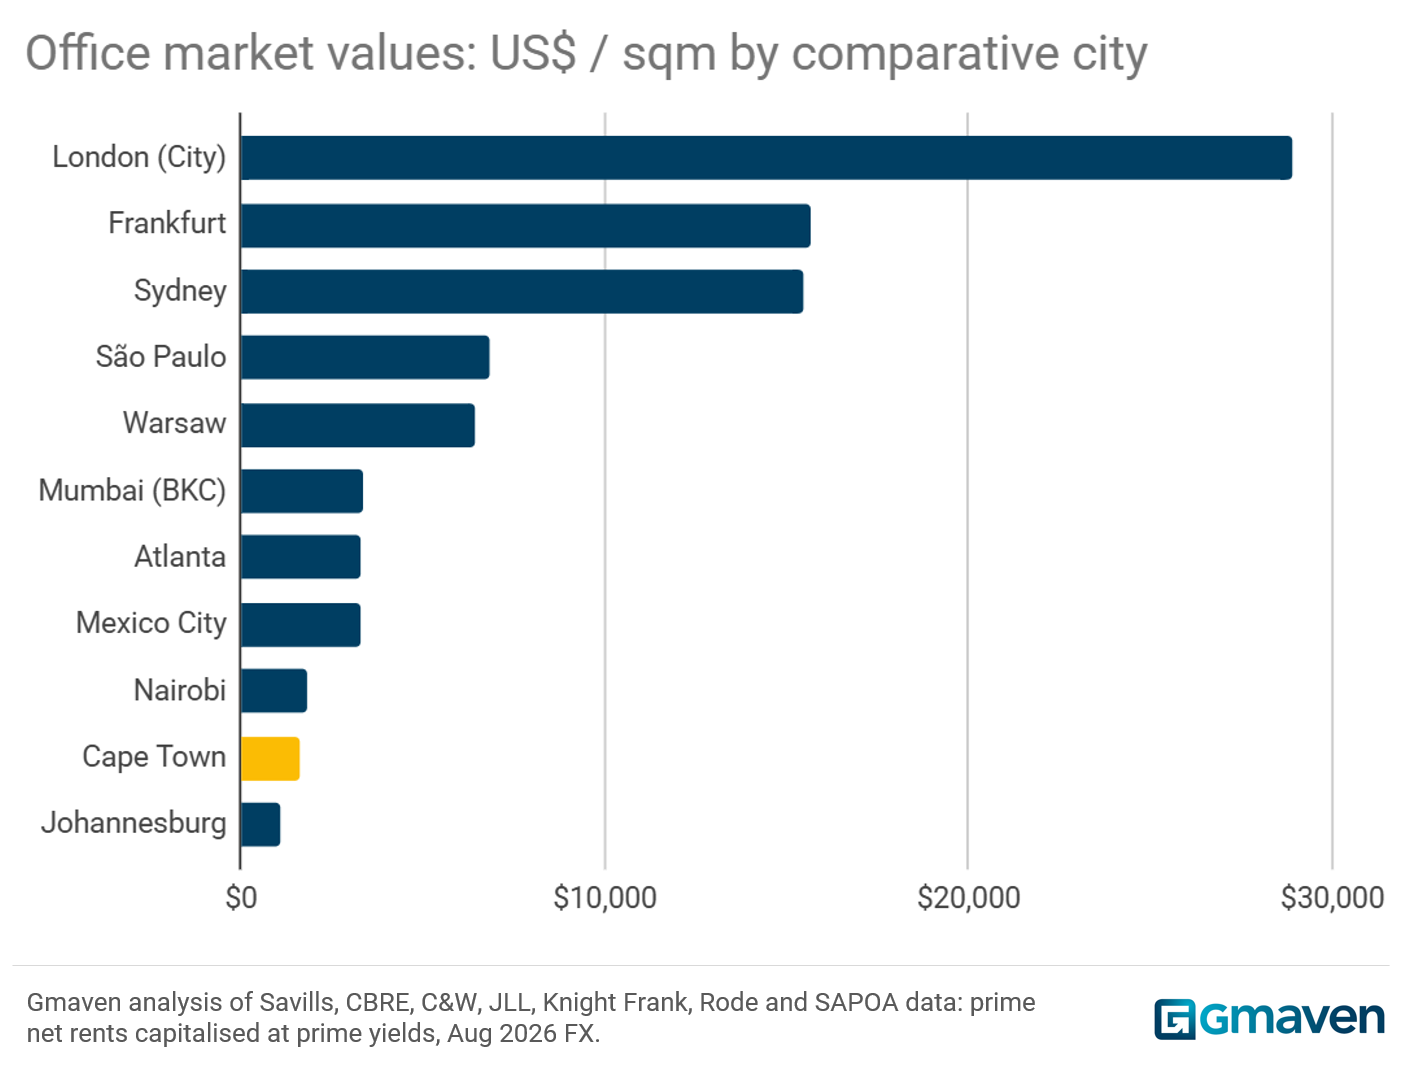
And this is no outlier. Across Johannesburg, well-designed, well-parked, A-grade offices are consistently selling for under R10,000 per square metre. Putting up the same building today would cost at least R28,000 per square metre, excluding the land (the “developable bulk”, as the industry calls it), though including the parking. In Cape Town the same product, usually with less parking, fetches around three times as much: in May 2026 Spear, a Cape-based property fund, bought 28,488 square metres of office space in Tyger Valley for R33,698 per square metre. An owner-occupier like Capitec would have paid a premium above that.

Everyone in commercial property knows Johannesburg is cheap. The interesting questions are by how much, and what it would take for the gap to close. We compared like with like across the two cities, and the answer to the first question is R196 billion. That is the discount buyers are currently applying to commercial property in Johannesburg municipality. For perspective: R196 billion is roughly 10% of the value of all commercial property in South Africa, or roughly five times Growthpoint’s market capitalisation attributable to its South African owned properties. And all of it is sitting in a single municipality.

The answer to the second question may arrive in November.

How Johannesburg commercial property lost its footing

Commercial property is supposed to be dull: illiquid, stable, slow-moving. In Johannesburg it has been anything but. As service delivery deteriorated, staff semigrated and public transport frayed, businesses voted with their feet. Some folded, others relocated, and demand fell. Landlords cannot conjure tenants, so owners have watched, largely helplessly, as value drained away.

In Cape Town, meanwhile, commercial values have kept pace with inflation, helped by an unemployment rate almost half Johannesburg’s. Property owners there feel like geniuses. Whether they are geniuses, or simply better governed, is what the numbers below try to settle.

What counts as Johannesburg

Before the numbers, two definitions. Commercial property is the property that business is run from: offices, industrial, retail (shops and shopping centres, gyms and dealerships), and a “specialist” category that takes in the likes of hospitals, hotels, education, storage and other assets. We have excluded residential for this exercise, from houses through to high-density, investment-grade blocks leased by a single landlord to multiple tenants. Codera has already done a fine job on house prices.

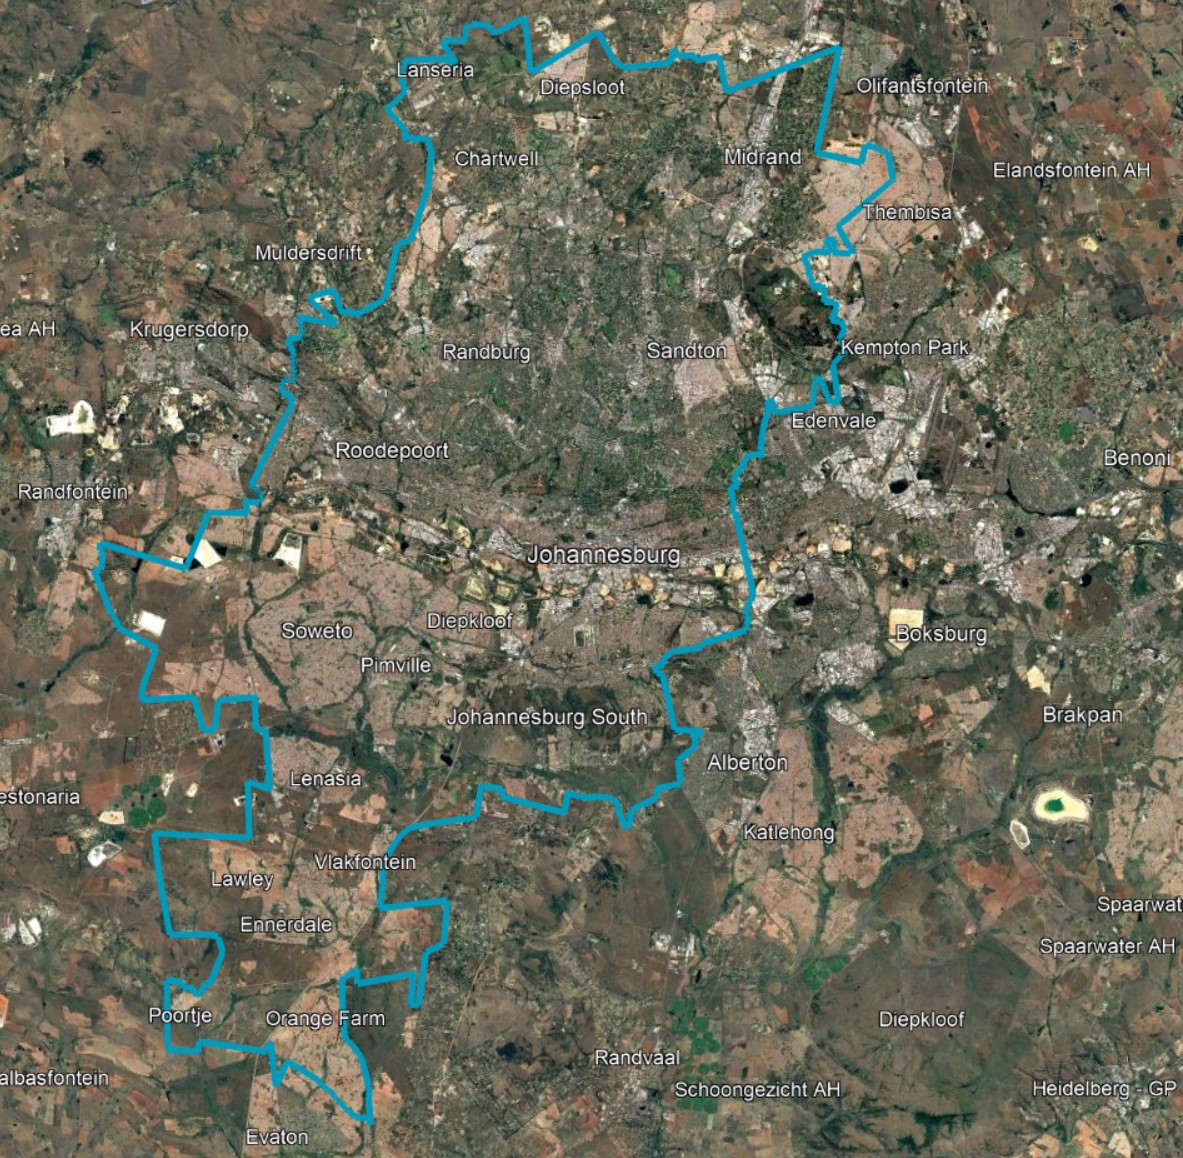
Second, the boundary, because the municipality is not the city as most people picture it. Johannesburg municipality takes in office nodes such as Sandton, Rosebank, Waterfall City and Melrose Arch, industrial nodes such as Strydompark, Linbro Park and Midrand, and iconic shopping centres such as Sandton City and Mall of Africa. Going clockwise, Johannesburg municipality stretches to areas on its border like Diepsloot, Longmeadow, City Deep, Orange Farm, Lenasia, Roodepoort and Lanseria. It excludes, again going clockwise, Samrand, Midstream, Clayville, Chloorkop, Germiston, Bedfordview, Meyersdal, Evaton and Krugersdorp. The city as commonly understood is actually two municipalities: Johannesburg plus Ekurhuleni, the East Rand, which is also home to OR Tambo International, the country’s major airport.

Gmaven - JHB municipality

Johannesburg municipality’s boundary. The city as commonly understood also includes Ekurhuleni (the East Rand).

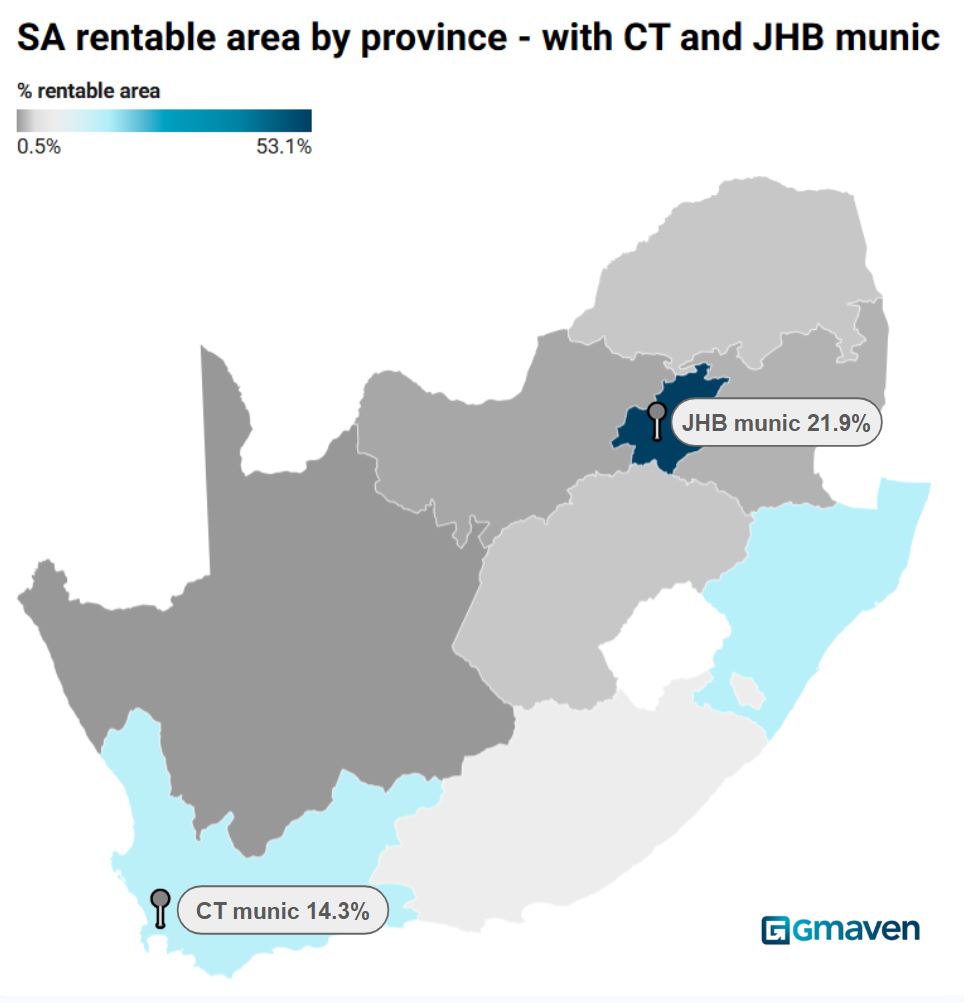
The stakes are national. South African commercial property is conservatively worth R2 trillion and covers 205 million square metres of rentable space. Johannesburg municipality alone accounts for 21.9% of the country’s gross lettable area, or GLA, the industry’s measure of rentable space. That is more than the whole of KwaZulu-Natal (16.3%) or the Western Cape (15.7%), and more than the six remaining provinces combined. Count the East Rand as well and the greater city holds 37.3% of all commercial space in the country.

South Africa GLA by province

South Africa’s commercial property activity by rentable area / GLA: by province, and comparative municipalities.

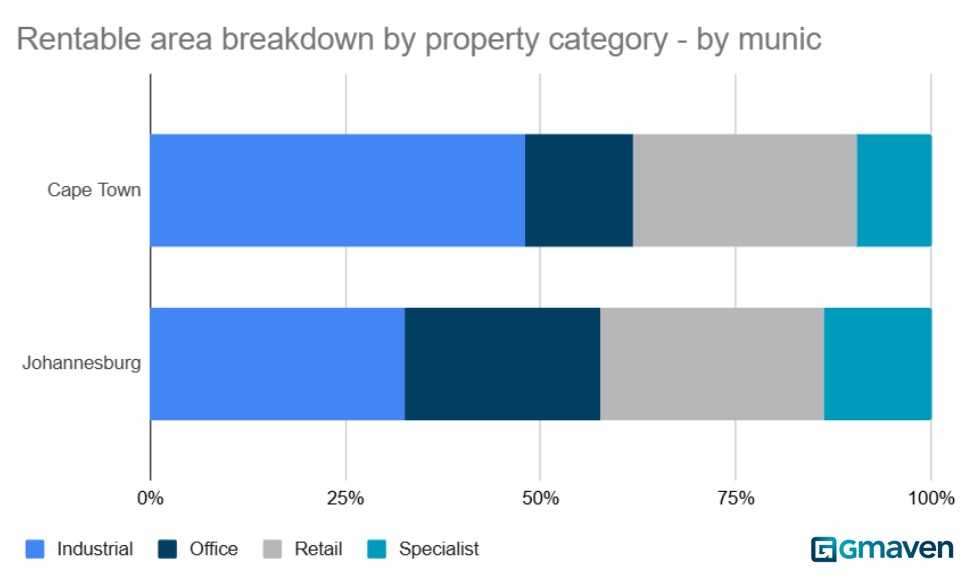
CT and JHB GLA by prop category

Cape Town and Johannesburg municipalities: rentable space by property category.

Two cities on paper

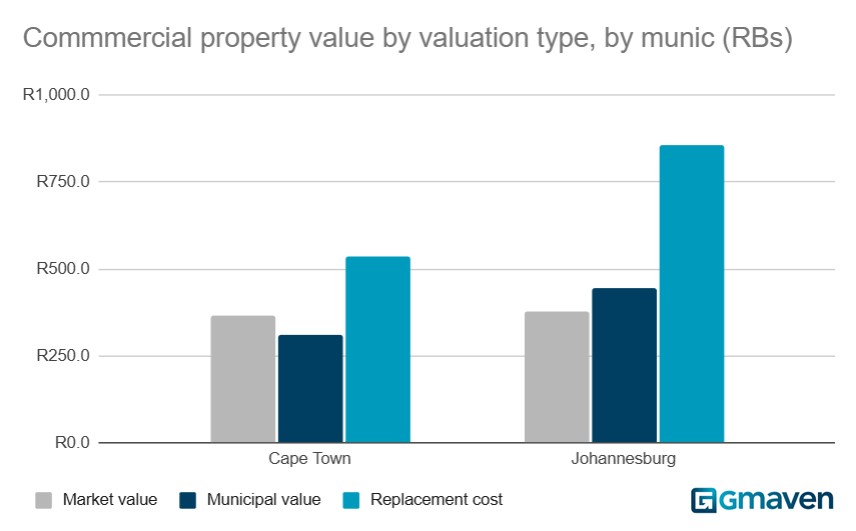
Cape Town’s total commercial rentable area comes to 29.2 million square metres, which is 468,300 squash courts, 49,100 tennis courts or 3,200 rugby fields, depending on your sport. Johannesburg’s is 44.9 million. Apply the sales evidence since 2020 to those stocks and the market values come out at R365 billion for Cape Town and R376 billion for Johannesburg. Johannesburg has 54% more space, but the market says the two cities are worth roughly the same.

The municipalities’ own books tell a different story again. The latest annual financial statements value commercial property at R310.7 billion in Cape Town and R444.5 billion in Johannesburg (as at 1 July 2022 each). If municipal valuations are meant to track the market, Johannesburg’s owners can expect some rates reductions in 2027.

Then there is the cost of building it all again. Not all buildings cost the same to put up: industrial is the cheapest to build, retail costs more, and office is the most expensive, in every case excluding the land or developable bulk. Priced at AECOM’s construction rates, on conservative assumptions, a wholesale redevelopment would cost (including bulk) R537 billion in Cape Town and R857 billion in Johannesburg. In Johannesburg, industrial has maintained its value, but buyers of retail and, above all, office have been buying close to just over a third the cost of construction.

JHB and CT CRE valuations by type

Commercial property values per municipality by specific valuation type.

Where the R200 billion sits

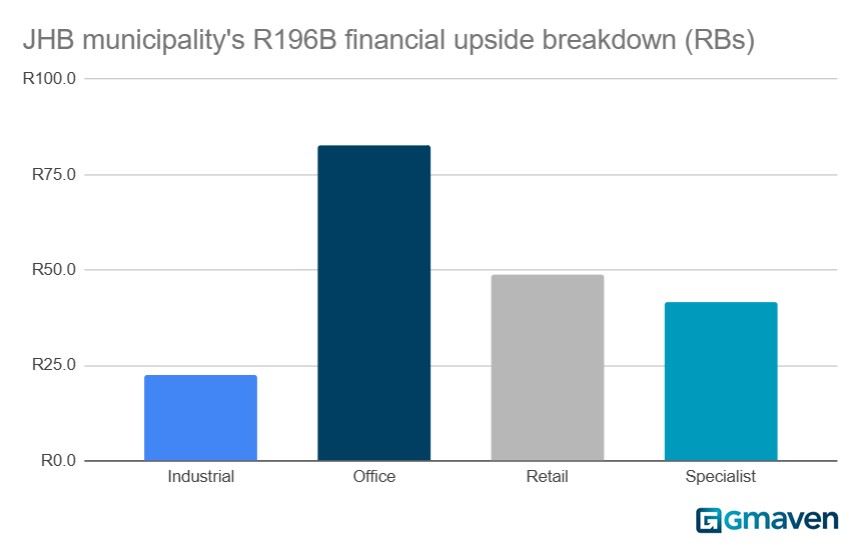
Adjust for Cape Town’s historical price premium and the uplift available to Johannesburg commercial property, category by category, comes to R196 billion. Office accounts for over 40% of it, followed by retail, then the ‘specialist’ category, then industrial.

JHB CRE upside by categ

Johannesburg municipality’s financial upside, in billions of rand, by contributing property category.

One variable

The conclusion is simple, and it is not about property people. The discount of Johannesburg commercial property says nothing about the quality of its property entrepreneurs and managers. It is not geography either: that is already priced in. What the market is pricing is one factor, the competence of local government, and it is the one factor that may change in November, when the city votes in local government elections. Cape Town, majority run by the Democratic Alliance for 15 years now, shows what the same asset class does under an administration that works.

If Johannesburg’s administration changes, and service delivery with it, the numbers above imply an enormous upswing in value and investment, to the benefit of investors, the employees of the property funds, construction firms and lenders alike. An improvement in South Africa’s economic growth will supercharge this. Johannesburg’s commercial property owners are overdue some luck. For once, they do not have to do anything to earn it. They just have to hope somebody fixes their city.

The data behind this story

Everything above is drawn from Gmaven’s national database of commercial properties and deeds office transfers: 25,700 matched properties across the two municipalities and 1,090 unique, high-value transactions since 2020. If you would like to understand what the data says about your own node, portfolio or asset class, we are here.

About the author

Related posts

Industry Intel and News
CRE deals in Africa: the inside story of Improvon’s CRM

Improvon’s East Africa team, focused on the fast-growing industrial market, overcame deal making frustrations and blockers by implementing a custom BI-focused, CRM system. With Africa-specific, data asset management, sentiment analytics, and dashboards for real-time pipelines the team is empowered to accelerate sales, resource better, support the team, and scale operations.


SA B2B data
Industry Intel and News
Data’s Edge: Manufacturer Activates R600M Extra Sales

Data-driven decision-making is a buzzword. Here is a practical example. Using unique CRE data, a major South African manufacturer figured out their actual penetration, identified R600M in untapped office market revenues and picked up their customers were paying 33% more. Using this data, the business could plan a precise sales strategy, prioritising the best-returning segments.

Industry Intel and News
AI Boosts Business: A Joe’s Journey

Over 40 and feeling the AI heat? Is it hype or hope? As a regular SA Joe with pretty good Excel and BA basics, I dove in to AI, tackling a real problem you likely wrestle with every day – moving raw data to useful output. Forget the 6 week old ways “black box”, I built a game-changer in 15 days. Join me as I share the wins, woes, and wisdom of my journey – proof you can too.

Leave a Reply

Your email address will not be published. Required fields are marked *

Fill out this field
Fill out this field
Please enter a valid email address.
You need to agree with the terms to proceed