


Johannesburg commercial property: the R200 billion discount

The opinion is that Johannesburg property is undervalued. What does the data say? Where is the value trapped? Gmaven data on 25,700 properties and 1,100 deals post 2020 points to the opportunities within this c.R400B market – comprising over one fifth of the SA commercial real estate industry’s rentable area.
CRE Johannesburg market study

Prime Sandton offices are changing hands for less than it costs to build a suburban house. The market has put a price on broken local government, and an election in November could hand Johannesburg commercial property owners a windfall for doing nothing.

Here is a deal worth pausing on. Capitec has just bought itself a new head office: the Discovery building on Fredman Drive in central Sandton, diagonally across from the Industrial Development Corporation. It is 21,946 square metres of generously parked, A-grade office space, near the top of the industry’s quality scale. The price? R245 million, which works out at R11,164 per square metre, parking bays included.

Now hold that number up against ordinary building work. A family house in Johannesburg, at a finish most readers would recognise, runs from R18,000 to R25,000 per square metre before the land, and excluding basement parking bays. Read that again: one of South Africa’s largest banks has paid less per square metre for a prime Sandton tower than you would pay a builder in the suburbs.

And this is no outlier. Across Johannesburg, well-designed, well-parked, A-grade offices are consistently selling for under R10,000 per square metre. Putting up the same building today would cost at least R28,000 per square metre, excluding the land (the “developable bulk”, as the industry calls it), though including the parking. In Cape Town the same product, usually with less parking, fetches around three times as much: in May 2026 Spear, a Cape-based property fund, bought 28,488 square metres of office space in Tyger Valley for R33,698 per square metre. An owner-occupier like Capitec would have paid a premium above that.

Everyone in commercial property knows Johannesburg is cheap. The interesting questions are by how much, and what it would take for the gap to close. We compared like with like across the two cities, and the answer to the first question is R196 billion. That is the discount buyers are currently applying to commercial property in Johannesburg municipality. For perspective: R196 billion is roughly 10% of the value of all commercial property in South Africa, or roughly five times Growthpoint’s market capitalisation attributable to its South African owned properties. And all of it is sitting in a single municipality.

The answer to the second question may arrive in November.

How Johannesburg commercial property lost its footing

Commercial property is supposed to be dull: illiquid, stable, slow-moving. In Johannesburg it has been anything but. As service delivery deteriorated, staff semigrated and public transport frayed, businesses voted with their feet. Some folded, others relocated, and demand fell. Landlords cannot conjure tenants, so owners have watched, largely helplessly, as value drained away.

In Cape Town, meanwhile, commercial values have kept pace with inflation, helped by an unemployment rate almost half Johannesburg’s. Property owners there feel like geniuses. Whether they are geniuses, or simply better governed, is what the numbers below try to settle.

What counts as Johannesburg

Before the numbers, two definitions. Commercial property is the property that business is run from: offices, industrial, retail (shops and shopping centres, gyms and dealerships), and a “specialist” category that takes in the likes of hospitals, hotels, education, storage and other assets. We have excluded residential for this exercise, from houses through to high-density, investment-grade blocks leased by a single landlord to multiple tenants. Codera has already done a fine job on house prices.

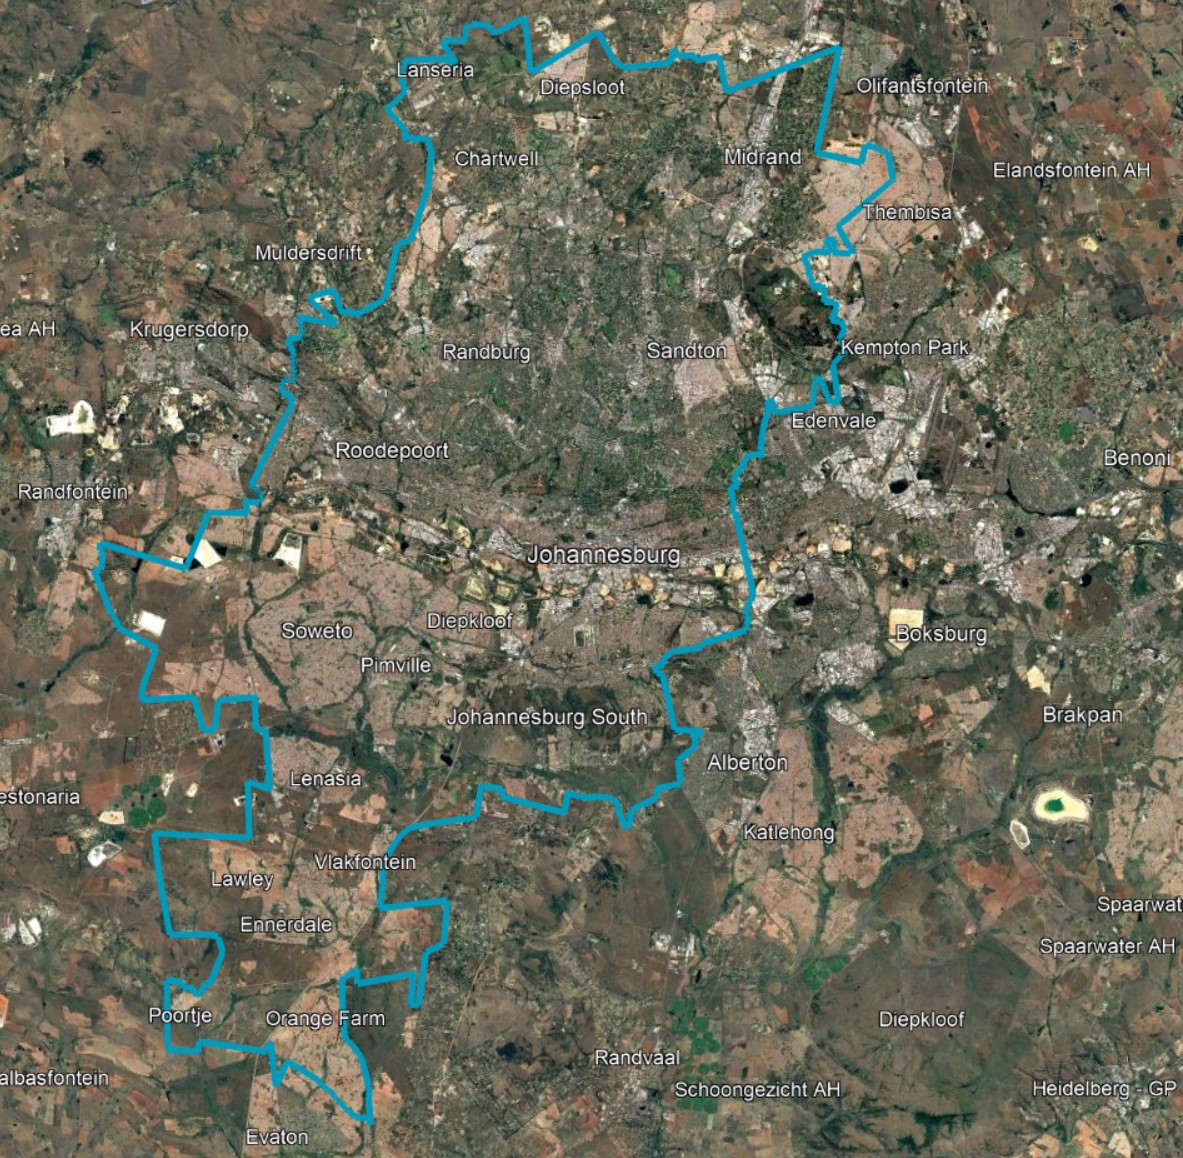
Second, the boundary, because the municipality is not the city as most people picture it. Johannesburg municipality takes in office nodes such as Sandton, Rosebank, Waterfall City and Melrose Arch, industrial nodes such as Strydompark, Linbro Park and Midrand, and iconic shopping centres such as Sandton City and Mall of Africa. Going clockwise, Johannesburg municipality stretches to areas on its border like Diepsloot, Longmeadow, City Deep, Orange Farm, Lenasia, Roodepoort and Lanseria. It excludes, again going clockwise, Samrand, Midstream, Clayville, Chloorkop, Germiston, Bedfordview, Meyersdal, Evaton and Krugersdorp. The city as commonly understood is actually two municipalities: Johannesburg plus Ekurhuleni, the East Rand, which is also home to OR Tambo International, the country’s major airport.

Gmaven - JHB municipality

Johannesburg municipality’s boundary. The city as commonly understood also includes Ekurhuleni (the East Rand).

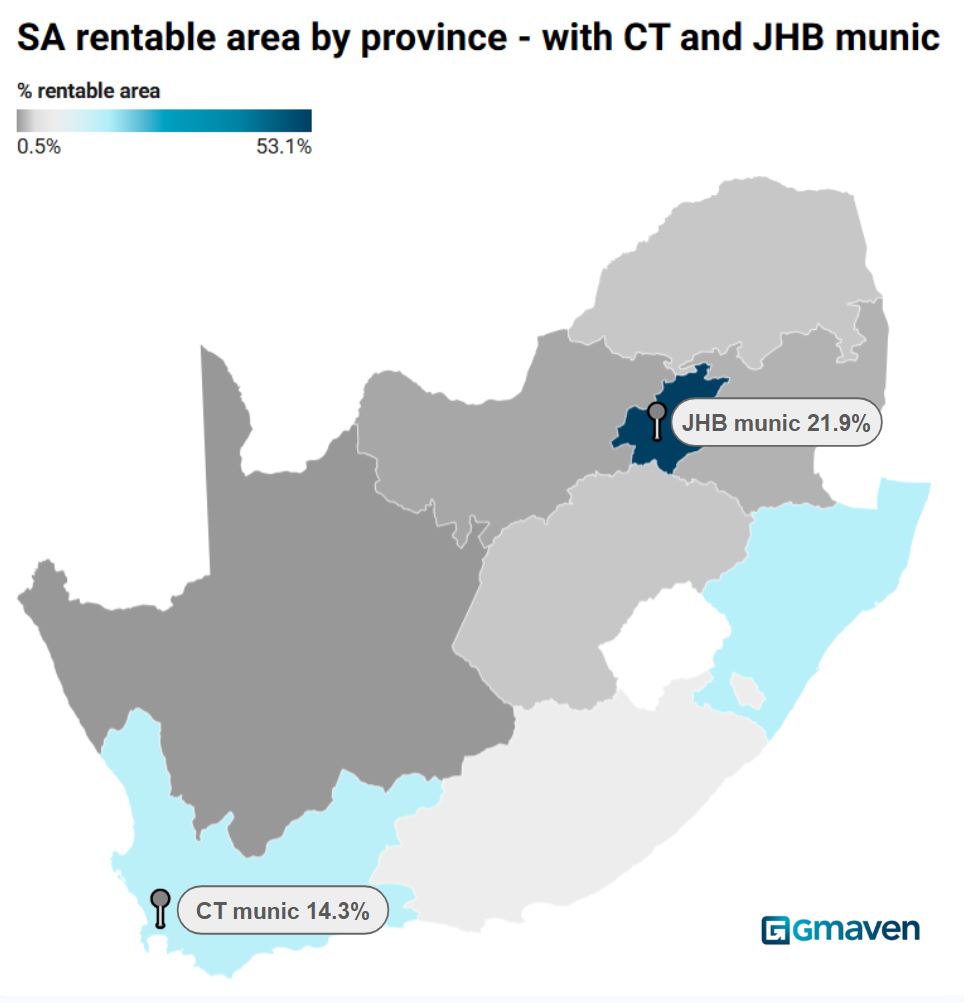
The stakes are national. South African commercial property is conservatively worth R2 trillion and covers 205 million square metres of rentable space. Johannesburg municipality alone accounts for 21.9% of the country’s gross lettable area, or GLA, the industry’s measure of rentable space. That is more than the whole of KwaZulu-Natal (16.3%) or the Western Cape (15.7%), and more than the six remaining provinces combined. Count the East Rand as well and the greater city holds 37.3% of all commercial space in the country.

South Africa GLA by province

South Africa’s commercial property activity by rentable area / GLA: by province, and comparative municipalities.

Apples with apples

A study this size demands rigour, because commercial property punishes lazy comparisons. Our analysis, drawn from Gmaven’s national commercial property database, covers 25,700 properties, matched on property grade, category and size, on comparable locations and, for retail, on sub markets and sub-categories, so that like is compared with like. The yardstick is market value: what a willing buyer actually pays, the truest determinant of value. Since 2020, 1,706 higher value commercial transactions worth a combined R83 billion have passed through the deeds office, the registry where South African property transfers are recorded. Stripping out duplicates, related parties, and high-noise portfolio transactions leaves roughly 1,100 unique, high-signal deals.

Here is what those deals, averaged over this time period (which straddled the Covid pandemic), say a square metre is worth in each city.

Weighted average value per square metreIndustrialOfficeRetailSpecialist
City of Cape TownR7,552R20,524R19,752R17,079
City of JohannesburgR5,550R10,121R13,787R8,238

Cape Town has traded above Johannesburg in every category. Industrial, mostly in the hands of owner-occupiers, has largely held its value on both sides of the divide. Office is where the damage sits: Cape Town office space, averaged out, trades at more than double Johannesburg’s R10,121 per square metre (despite the latter being, generally, better parked). Retail in Johannesburg has felt pain too. Recent transactions, across the board, see the gap widening. And that, for anyone hunting value, is where the opportunity lies.

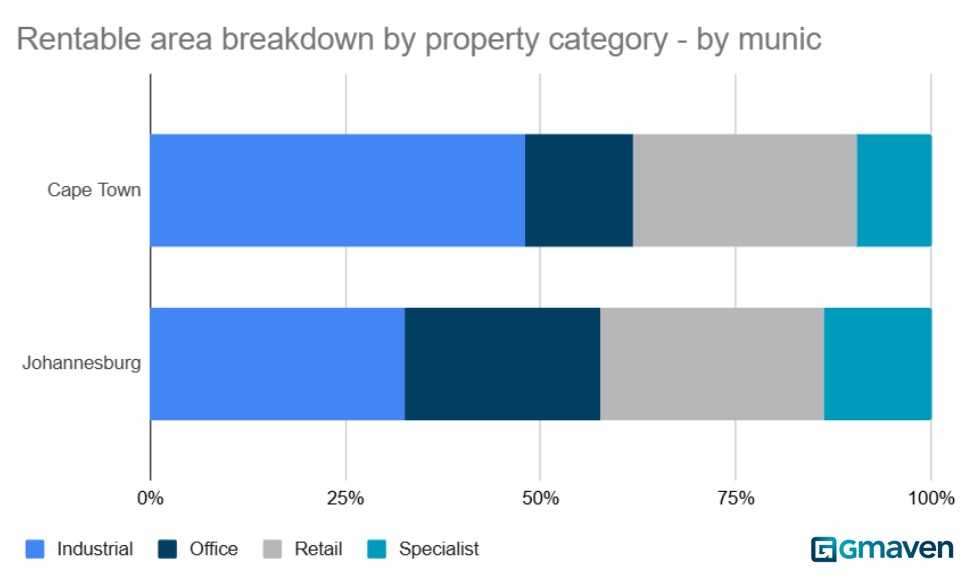
The two municipalities are also built differently, and not in the way you might guess. Cape Town is the industrial-heavy one: industrial makes up 47.9% of its rentable area, against 13.9% for office, 28.6% for retail and 9.5% for “specialist”. Johannesburg commercial property is far more evenly spread: 32.5% industrial, 25.2% office, 28.6% retail and 13.7% “specialist”. Part of the reason is that Johannesburg’s industrial heartland is not in Johannesburg at all, but next door in the East Rand: Ekurhuleni municipality has 168% of the industrial floor space of its neighbour to the west. The combined city boasts 51.2% industrial, and only 16.1% office.

CT and JHB GLA by prop category

Cape Town and Johannesburg municipalities: rentable space by property category.

Two cities on paper

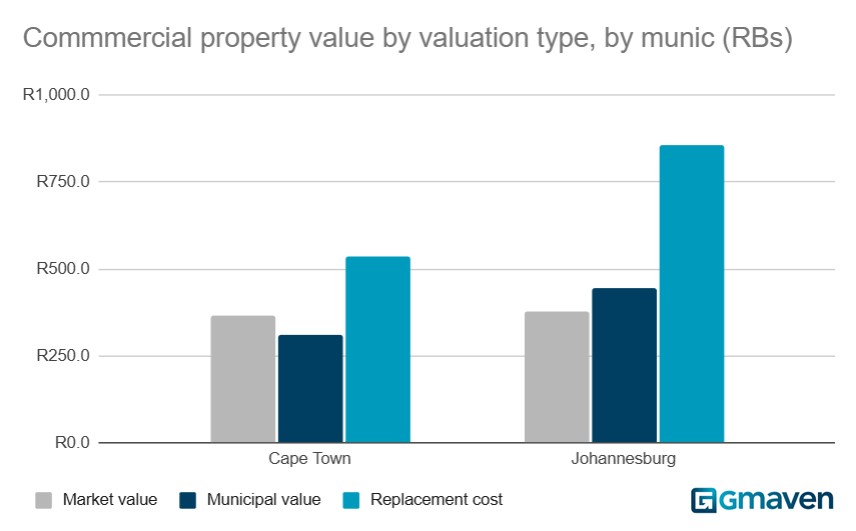
Cape Town’s total commercial rentable area comes to 29.2 million square metres, which is 468,300 squash courts, 49,100 tennis courts or 3,200 rugby fields, depending on your sport. Johannesburg’s is 44.9 million. Apply the sales evidence since 2020 to those stocks and the market values come out at R365 billion for Cape Town and R376 billion for Johannesburg. Johannesburg has 54% more space, but the market says the two cities are worth roughly the same.

The municipalities’ own books tell a different story again. The latest annual financial statements value commercial property at R310.7 billion in Cape Town and R444.5 billion in Johannesburg (as at 1 July 2022 each). If municipal valuations are meant to track the market, Johannesburg’s owners can expect some rates reductions in 2027.

Then there is the cost of building it all again. Not all buildings cost the same to put up: industrial is the cheapest to build, retail costs more, and office is the most expensive, in every case excluding the land or developable bulk. Priced at AECOM’s construction rates, on conservative assumptions, a wholesale redevelopment would cost (including bulk) R537 billion in Cape Town and R857 billion in Johannesburg. In Johannesburg, industrial has maintained its value, but buyers of retail and, above all, office have been buying close to just over a third the cost of construction.

JHB and CT CRE valuations by type

Commercial property values per municipality by specific valuation type.

Where the R200 billion sits

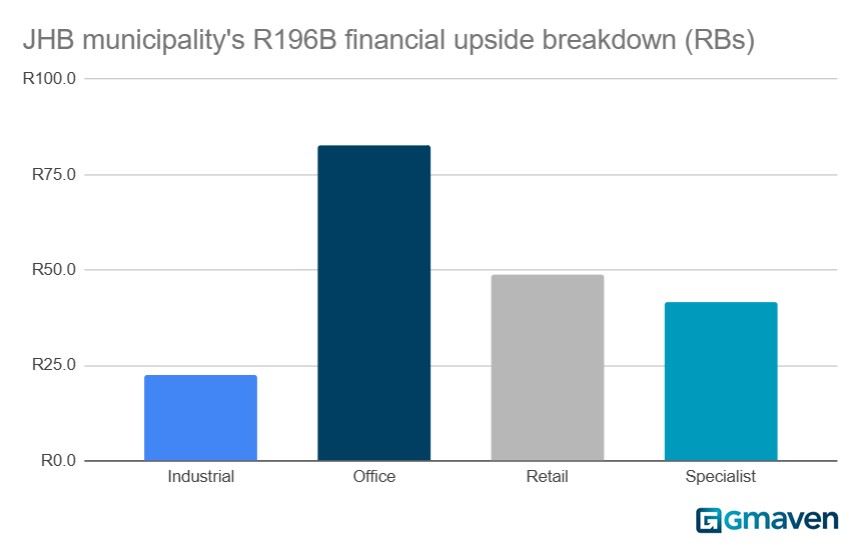
Adjust for Cape Town’s historical price premium and the uplift available to Johannesburg commercial property, category by category, comes to R196 billion. Office accounts for over 40% of it, followed by retail, then the ‘specialist’ category, then industrial.

JHB CRE upside by categ

Johannesburg municipality’s financial upside, in billions of rand, by contributing property category.

One variable

The conclusion is simple, and it is not about property people. The discount of Johannesburg commercial property says nothing about the quality of its property entrepreneurs and managers. It is not geography either: that is already priced in. What the market is pricing is one factor, the competence of local government, and it is the one factor that may change in November, when the city votes in local government elections. Cape Town, majority run by the Democratic Alliance for 15 years now, shows what the same asset class does under an administration that works.

If Johannesburg’s administration changes, and service delivery with it, the numbers above imply an enormous upswing in value and investment, to the benefit of investors, the employees of the property funds, construction firms and lenders alike. An improvement in South Africa’s economic growth will supercharge this. Johannesburg’s commercial property owners are overdue some luck. For once, they do not have to do anything to earn it. They just have to hope somebody fixes their city.

Cheap by any measure: the international comparison

The deeds evidence above prices Johannesburg against Cape Town.

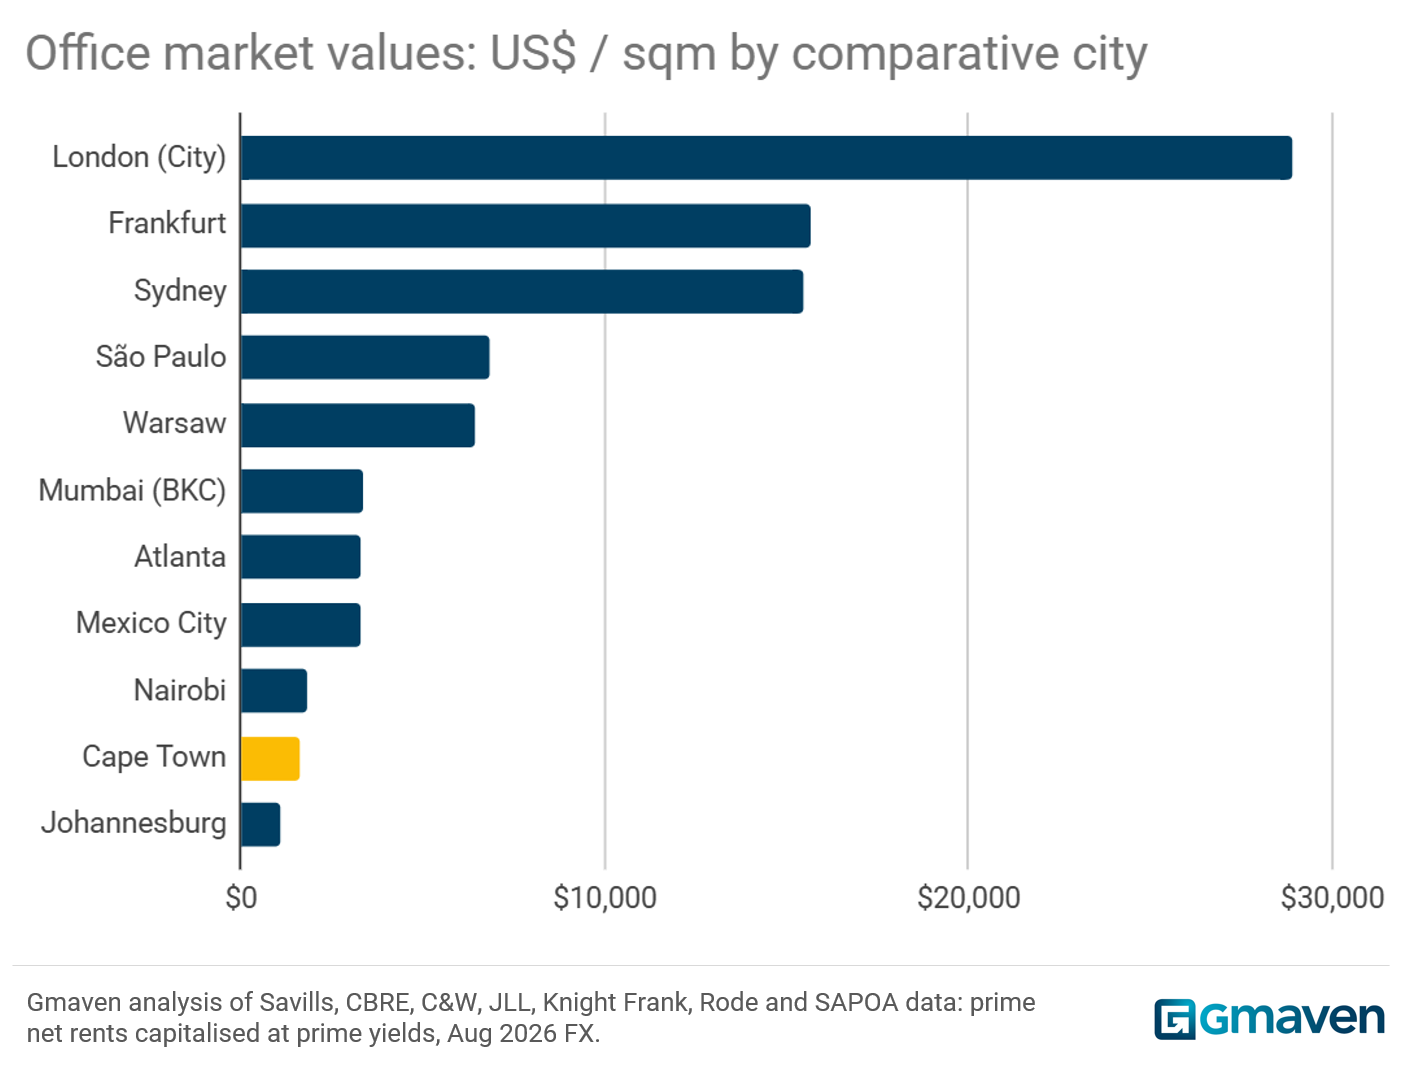
A second, independent lens prices both against the world: take each city’s published prime office rent, convert it to US dollars, strip it to net income, and capitalise it at that market’s prime yield. See the image below:

SA office market value comparisons

The method differs deliberately from the transaction analysis above, and it lands in the same place. As per above, Johannesburg is the cheapest prime office market on the list, and Cape Town, so often accused of being a bubble, prices below Nairobi.

For the detail on this, see the table below:

Prime office values, US$ per square metre, implied by capitalising prime net rents at each market’s prime yield. August 2026 exchange rates.

City Country Prime definition (as sourced) Area basis Rent basis Prime rent US$/m²/mo Prime rent US$/m²/yr Net income ratio Prime yield Implied value US$/m² As-at (rent / yield) Sources
Johannesburg South Africa SAPOA P / A grade, decentralised nodes SAPOA rentable (GLA) Gross market rent – SAPOA, Rosebank $13.22 $158.67 0.75 ** 11.2% $1,063 Q3 2026 / Q4 2025 S1, S2, S-SAPOA
Cape Town South Africa SAPOA P / A grade, decentralised nodes SAPOA rentable (GLA) Gross market rent – SAPOA, Claremont $16.92 $203.08 0.75 ** 9.5% $1,603 Q3 2026 / Q2–Q4 2025 S1, S2, S-SAPOA
Nairobi Kenya Prime Grade A (Knight Frank) Lettable, per KF convention Headline, quoted in US$ $13.00 $156.00 1.00 8.5% $1,835 H2 2025 S4
Mexico City Mexico Class A average asking (JLL) Rentable Asking, quoted in US$ $24.40 $292.80 1.00 9.0% † $3,253 Year-end 2025 S15
Atlanta United States Class A / A+ average asking BOMA rentable Full-service gross (incl. opex and taxes) $36.85 $442.19 0.65 *** 8.7% $3,304 FY 2025 / Q3 2025 S13, S14
Mumbai (BKC) India Grade A, Bandra Kurla Complex Leasable (loading applies) Headline $22.50 $269.94 1.00 8.0% † $3,374 2025 S17
Warsaw Poland Prime central (AXI IMMO, top of range) Rentable (PINK standard) Headline, quoted in EUR $31.98 $383.72 1.00 6.0% $6,395 FY 2025 S12
São Paulo Brazil Class A prime districts (Itaim / Faria Lima) BOMA-style rentable Asking $53.95 $647.40 1.00 9.5% † $6,815 Q3–Q4 2025 S16
Sydney Australia Prime CBD (Cushman & Wakefield) NLA (PCA method) Gross face, before incentives $104.67 $1,256.03 0.75 ** 6.1% $15,443 Q4 2025 / Q1–Q2 2026 S5, S6
Frankfurt Germany Prime CBD (JLL / CBRE) Rentable, GIF standard Headline (net cold rent) $63.95 $767.44 1.00 4.9% $15,662 Q1 2026 S9, S10
London (City) United Kingdom City prime (Savills average prime) NIA / IPMS 3 Headline, excl. rates and service charge, before incentives $127.59 $1,531.11 1.00 5.3% $28,889 Q4 2025 / Q3 2025–Q1 2026 S7, S8

** Quoted rent is gross (includes recoverable operating costs); reduced to net income by deducting 25% before capitalisation. *** Atlanta rents are full-service gross, which also includes property taxes; reduced by 35%. Rows at 1.00 quote net or headline rents, where the tenant pays operating costs separately. † Yield is a Gmaven market estimate; see Appendix B. Method, sources and exchange rates in Appendix B below.

Appendix: method and data notes

Design. The analysis is a stratified cross-sectional comparison of transaction evidence, not a repeat-sales or hedonic index. South African commercial property transacts infrequently, and too few properties sold more than once in the window to support a repeat-sales design; stratification into like-for-like cells is the substitute for property-level controls.

Data. Registered transfers from the deeds office, 2020 to mid 2026: 1,706 higher-value commercial transactions with an aggregate consideration of R83 billion, drawn against a matched universe of 25,700 properties in Gmaven’s national database.

Sample construction. Transactions were excluded under pre-specified filters: duplicates; non-arm’s-length transfers (related parties and nominal-consideration transfers); portfolio transactions where consideration could not be attributed to individual assets; unresolvable deeds office errors; partial transfers and undivided shares; and clear outliers. Roughly 1,100 unique, high-signal transactions were retained.

Stratification and estimation. Each transaction is classified by property category (industrial, office, retail, specialist), SAPOA grade, size band by gross lettable area (GLA), and node or catchment area; retail is additionally stratified by sub-market and sub-category. The estimator is the mean sale price per square metre of GLA within each city and category, weighted by GLA, so that large properties carry proportionate weight and no single transaction can dominate a cell. Because both the averaging and the later extrapolation are GLA-weighted, aggregate and within-stratum comparisons sit on the same basis.

Premium adjustment. Cape Town has, in recent times, traded at a premium to Johannesburg commercial property. No market-published measure of that historical premium exists; the per-category premiums applied here are Gmaven’s proprietary estimates, and neither the premiums nor their derivation is disclosed. These premiums are deducted from Cape Town’s weighted averages before any gap is measured. Only the residual differential, the excess beyond the long-standing premium, is treated as Johannesburg commercial property’s mispricing.

Extrapolation. The residual per-square-metre differential is applied, category by category, to Johannesburg commercial property’s rentable stock, and summed. The extrapolation assumes that, within each stratum, unsold stock resembles transacted stock.

Limitations, stated plainly. Values are nominal averages over the full window, unadjusted for inflation, which understates the current gap. Only transacted properties are observed; stratification mitigates, but cannot eliminate, selection effects in which properties come to market. The premium adjustment rests on proprietary inputs (range 6% to 15%). No statistical significance is claimed for any individual cell. The analysis quantifies the observed price differential between the two markets; the attribution of the excess gap to municipal administration is an interpretation the transaction record supports but cannot, on its own, prove.

Appendix B: the international office value benchmark, method and sources

Method. The international comparison is a capitalisation exercise, deliberately independent of the deeds-based analysis above: it uses no Gmaven transaction data. For each city: the published prime office rent is taken exactly as the source states it; converted to US dollars per square metre per year at August 2026 exchange rates; reduced to net income where the quoted rent is gross (see rental bases below); and divided by that market’s prime yield, the annual net income an investor demands per unit of value. The result is an implied capital value per square metre, the price at which the published rent delivers the published yield. These are implied values, not transaction records; where a market’s actual deals price above or below its published prime rent and yield, the implied value will differ accordingly.

South African rentals. The Johannesburg and Cape Town rentals are SAPOA (South African Property Owners Association) market rentals, per its standard quarterly report for Q3 2026, for two high-performing decentralised office nodes, Rosebank and Claremont respectively, chosen deliberately as arguably the top of each market so that the “South Africa is cheap” conclusion is reached the hard way. Each city’s figure blends the node’s P-grade and A-grade gross market rentals, weighted one third P and two thirds A to reflect the composition of prime stock: R214 per square metre per month for Rosebank and R274 for Claremont, converted at R16.21 to the dollar. Grades follow the SAPOA classification (P, A, B, C, with P the premium tier).

Two rental bases, one adjustment. Cities publish rents on different bases, and yields capitalise net income, so the two must be reconciled before division. Where the quoted rent is gross, meaning it includes recoverable operating costs (both South African cities, per SAPOA convention, and Sydney’s gross face rents), a net income ratio of 0.75 is applied, treating operating costs as roughly a quarter of the gross rent. Atlanta’s full-service gross rents also include property taxes, so a heavier 0.65 applies. Cities quoting net or headline rents, where the tenant pays operating costs separately on top (Nairobi, Mexico City, Mumbai, Warsaw, São Paulo, Frankfurt, London), are already stated as net income and carry no adjustment; applying one there would deduct operating costs twice. Incentives (rent-free periods and fit-out contributions) are ignored on all rows. Since incentives run high in markets such as Sydney and London and modest in South Africa, ignoring them overstates the offshore values rather than the South African ones, which makes the cheapness conclusion conservative.

Measurement standards. Each row states its area basis (SAPOA rentable, BOMA rentable, NIA / IPMS 3, and so on). These standards measure the same building differently, by up to 10 to 15 percent, and are stated rather than adjusted for; the ranking is robust to differences of that size, but per-square-metre figures should not be read to greater precision than the area bases allow.

Exchange rates. Mid-market, 17 to 18 August 2026: R16.21, A$1.41, £0.74, €0.86, R$5.19 and ₹95.7 per US dollar. Dollar figures move with these rates daily; the table is a snapshot, not a series.

Yields. Prime yields for Johannesburg, Cape Town, Nairobi, Sydney, London, Frankfurt, Warsaw and Atlanta are published broker or Rode figures, per the sources below. The Mexico City, São Paulo and Mumbai yields (marked † in the table) are Gmaven estimates drawn from broker commentary and listed-vehicle pricing, pending a published prime yield for those markets; a one-percentage-point yield difference moves those implied values by roughly 10 to 12 percent, without changing the ranking.

Sources. Source numbering follows Gmaven’s master workings file, so the sequence below has deliberate gaps where a source relates to workings not shown here.

S-FX. Mid-market exchange rates, 17 to 18 August 2026, cross-checked across xe.com, Wise and Trading Economics.
S-SAPOA. SAPOA standard quarterly report, Q3 2026: market rentals by node and grade; Rosebank and Claremont, P and A grades.
S1. Rode’s Report for the South African Property Industry, Q4 2025 (summarised by WatchProp, February 2026): decentralised A-grade office capitalisation rates 11.2%; Cape Town the lowest of the metros.
S2. WatchProp, “Western Cape Property Market Extends Its Lead in 2025” (Rode Q2 2025 data): Cape Town grade-A decentralised office capitalisation rates 9% to 10%.
S4. Knight Frank Africa Office Market Dashboard, H2 2025: Nairobi prime Grade A rents circa US$13/m²/month; prime yield 8.5%.
S5. Cushman & Wakefield Marketbeat, Sydney CBD Office, Q1 2026: prime yield 6.13%; the Q2 2026 edition reports yields drifting modestly wider.
S6. Sydney average gross CBD face rent A$1,771/m²/year, market update, November 2025.
S7. Savills Central London Office Market Watch, January 2026 edition (year-end 2025 data): average City prime rent £105.26/sq ft; City prime yield 5.25% (Q3 2025).
S8. Cushman & Wakefield London Offices Marketbeat, Q1 2026: City core prime yield held at 5.50% (corroboration; 5.3% used).
S9. CBRE Frankfurt Office Market, Q1 2026: prime rent €55.00/m²/month; prime CBD yield 4.9%, stable since Q3 2025.
S10. JLL Frankfurt Office Market Dynamics, Q4 2025: prime rent €52.00/m²/month (corroboration).
S12. AXI IMMO, Warsaw Office Market 2025: prime central headline rents €19.00 to €27.50/m²/month (top of range used); Knight Frank Poland office research, 2025: Warsaw prime yield 6.0%; Savills Warsaw Q1 2025 corroborates the rent range.
S13. CommercialCafe, Atlanta office market trends, 2025: Class A / A+ average asking rent US$41.08/sq ft/year, full-service gross.
S14. Partners Real Estate, Atlanta Office, Q3 2025: average capitalisation rate 8.7%.
S15. JLL Latin America office market analysis, year-end 2025: Mexico City Class A average rent US$24.4/m²/month.
S16. Cushman & Wakefield, São Paulo premium offices insight, late 2025: Faria Lima and JK average asking rent R$280/m²/month (best stretches R$316, peaks R$350).
S17. Anarock and market reports, Mumbai, 2025: Bandra Kurla Complex prestige range ₹180 to ₹250/sq ft/month, midpoint ₹200 used; CBRE’s global tracker reports BKC prime rents up 18.1% year on year.

About the author

Related posts

Industry Intel and News
CRE deals in Africa: the inside story of Improvon’s CRM

Improvon’s East Africa team, focused on the fast-growing industrial market, overcame deal making frustrations and blockers by implementing a custom BI-focused, CRM system. With Africa-specific, data asset management, sentiment analytics, and dashboards for real-time pipelines the team is empowered to accelerate sales, resource better, support the team, and scale operations.


SA B2B data
Industry Intel and News
Data’s Edge: Manufacturer Activates R600M Extra Sales

Data-driven decision-making is a buzzword. Here is a practical example. Using unique CRE data, a major South African manufacturer figured out their actual penetration, identified R600M in untapped office market revenues and picked up their customers were paying 33% more. Using this data, the business could plan a precise sales strategy, prioritising the best-returning segments.

Industry Intel and News
AI Boosts Business: A Joe’s Journey

Over 40 and feeling the AI heat? Is it hype or hope? As a regular SA Joe with pretty good Excel and BA basics, I dove in to AI, tackling a real problem you likely wrestle with every day – moving raw data to useful output. Forget the 6 week old ways “black box”, I built a game-changer in 15 days. Join me as I share the wins, woes, and wisdom of my journey – proof you can too.

Leave a Reply

Your email address will not be published. Required fields are marked *

Fill out this field
Fill out this field
Please enter a valid email address.
You need to agree with the terms to proceed