Bryanston offices: “before and after”, and 10 years from now

Using aerial images, we do a “before and after” on Bryanston – and explain the difference. We then lean on the expertise of a town planner to understand the current development rights available, what Bryanston will look like 10 years from now and the factors to influence it, and reference this to workers and property values. At the risk of…
Bryanston 10 years from now CRE

There are two parts to this article.

The first part looks at Bryanston over the last 10 years. The second tries to crystal ball gaze where Bryanston will be in the next 10.

Due to its historical low-density zoning and power supply constraints, the suburb is characterised by low-rise offices and low-density office parks. This is reinforced by the numbers – for example, 707.6K sqm of leasable area is located on 1,883,120 sqm of land specifically used for office.

This translates into an average floor to area ratio (FAR) of 0.38. Remember this number and concept, we will come back to it later… (Out of interest, Sandton’s average floor to area ratio is exactly 1.00 (based on the total area of land specifically used for office is 2,078.2K sqm))

Explaining this in simpler terms – the tallest office building in Bryanston, Knightsbridge, is on four storeys. Meanwhile, in Sandton, the tallest office building is Sandton City’s Office Towers – reaching twenty storeys, and clearly visible on the skyline.

In summary, Bryanston’s density compared to Sandton is low – this provides “room for growth”.

Bryanston before and after

Has Bryanston changed much in the last ten years?

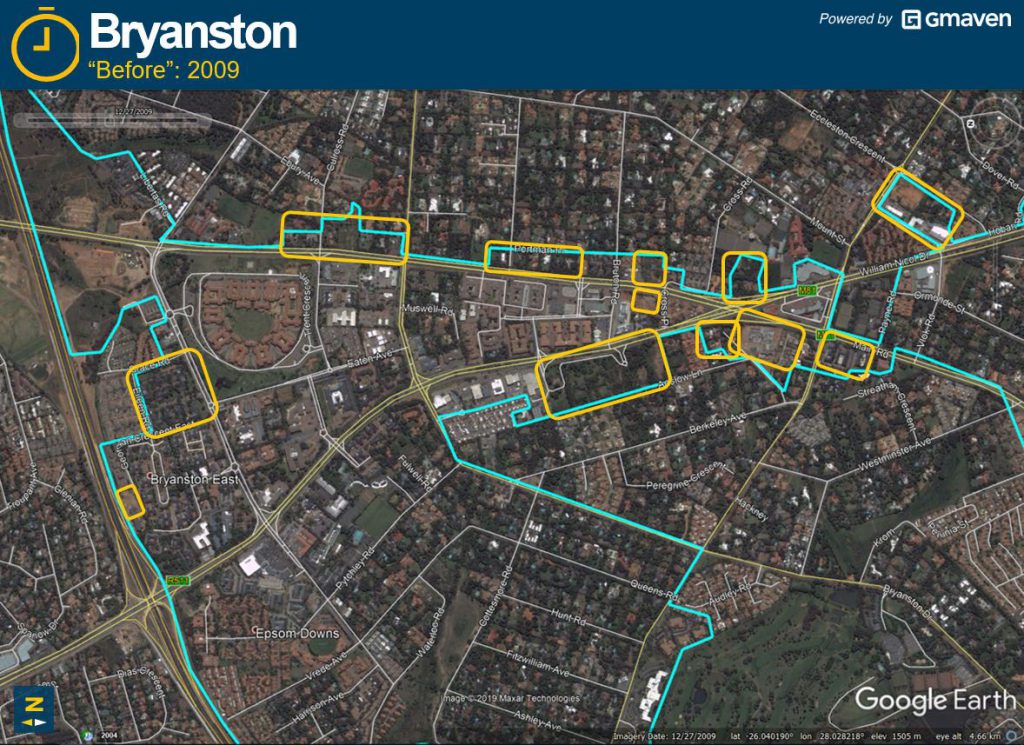
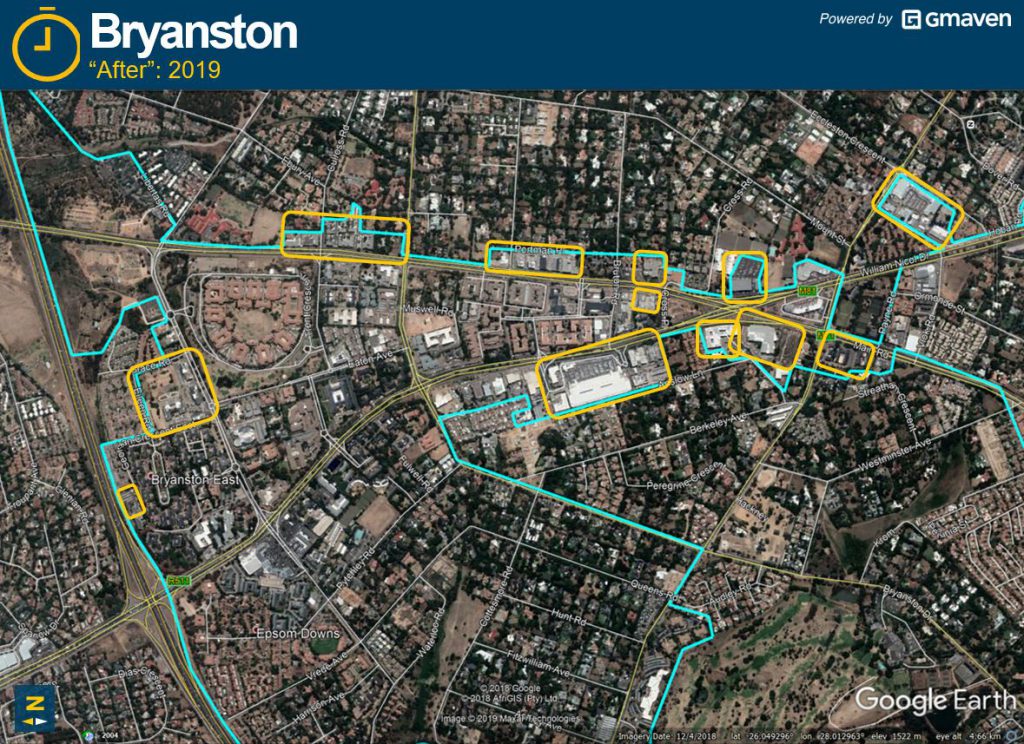
The graphics below give you a Bryanston “before and after” photo:

Bryanston CRE office 2009
Bryanston CRE office image now

As can be seen, from the Bryanston 2009 picture, the northern part of the node has been boosted by construction activity, covering (except for building recycles) the full gamut of development permutations, in the last decade:

  • RPP / Stratford and Barrow can boast of successful land assemblies along Main Road.
  • Nicolway Center and Hobart Square have been big retail plays.
  • The Knightsbridge property at the end of Eaton Road, opposite The Campus, was a redevelopment by Emira.
  • Bigger property funds such as Zenprop and Growthpoint climbed in on traditional greenfields developments / new builds.

All in all, approximately 159.3K sqm (comprising 35.2.K retail and 124.1K office) have come onstream since 2009.

The total size of office has thus grown 21.3% in this 10 year period.

Bryanston 10 years from now

Where it gets interesting… According to Guy Balderson, town planner, office development in the heart of Bryanston (in picture above) is currently controlled by a plan which actually allows for offices up to 7 storeys and a FAR of 0.6 (with a maximum coverage of 70%). Further – where infrastructure allows, an FAR of 1.0 can be supported.

However, this is due to increase further in the future.

The City of Johannesburg’s Nodal Review, applicable to the same area (and generally major news for Johannesburg’s town planning world), is due to be adopted soon. This proposed Nodal Review will allow heights up to 10 storeys – with FAR and coverage increases able to be motivated by developers on a case by case basis. Further, the upcoming nodal review allows for high density residential development within the node.

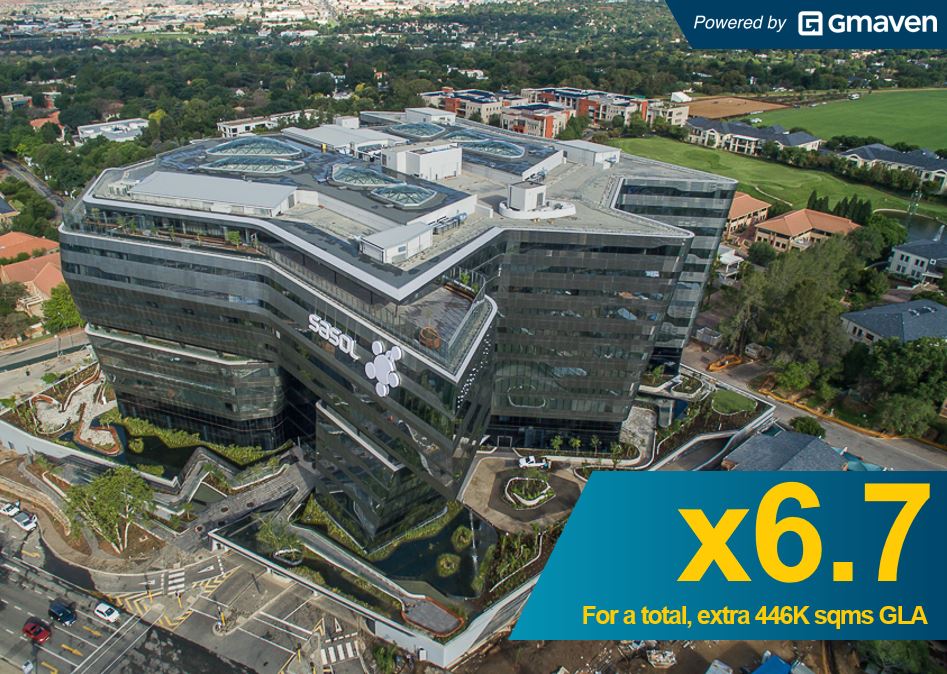
What this means: applying an FAR through rate of 0.6 to the greater node (remember Bryanston’s current FAR is 0.37, and Sandton’s is 1.00) would mean an increase in lettable area of 446.6K sqms – the equivalent of almost 7 Sasol Sandton buildings!

Sasol comparisons Bryanston

Working on an assumed office density of 15 sqms per person, this would increase the number of office workers from the current estimated 47K to 77K – roughly 30K extra humans.

Worst case – that’s a lot of cars, and a lot of traffic!

So how do nodes get there? We quote Balderson:

“It is our opinion that office development in Bryanston could be stimulated by the provision of public transport and the inclusion of residential units into the nodal core. The latter would create a mixed-use nodal environment commonplace in urban centres.”

Thus, an increase in high rise flats and apartments (as can be seen in Rosebank currently) coupled with improved public transport will activate growth. This will be fuelled by alternative sources of power and can be augmented by Bryanston cannibalising other competing nodes (such as Fourways, Rivonia, Sandton and Randburg).

Three factors act as a hand-brake to this anticipated growth:

  1.  Balderson cautions: “we are not aware of any plans to improve public transport in Bryanston. While Gautran stations are planned for Randburg and Fourways, the future phases of the Gautrain do not currently include a station in Bryanston. Further, we have not seen any plans by the City to expand their Rea Vaya bus system to Bryanston”. For more information on this rationale, please read up on transit-orientated development.
  2. Property maths. The following is based on the assumption that the bulk of Bryanston’s property opportunities have been developed out (if, however, cheap, well-accessed, Bryanston land zoned for office can be unlocked, all of the below can be ignored). New high density developments in contained business nodes require old, low-density developments to flatten. The maths work where either a) these low density developments have low valuations, or b) asking rentals are increasing, increasing the ability for landlords to “pay for air” (aka developable bulk), or c) the new development can be super dense – allowing the cost of the old development to be spread over many more square meters. The challenge is that Bryanston’s heart has few low-density and low-valued properties available for redevelopment.
  3. It’s the economy, stupid” – a quote from James Carville, campaign strategist of Bill Clinton’s successful 1992 presidential campaign. Unfortunately, Bryanston has around 53.0K excess vacancy (Calculation: 81.2K sqm vacant now less say 28.2K sqm (the existing total GLA at 4% full absorption)) still to be taken up. On a ratio of 15 sqm per person, this means that 3.5K jobs need to move to Bryanston – that’s a lot of economic growth required for tenants to drive CRE investors to build more space! See below for more detail:

<- click here to check this article out

Bryanston currently has developers with their fingers on the trigger of 20,9K sqm (of user-driven) property development in the public domain.

With the combination of variables, it’s going to be incredibly difficult to bet correctly what “Bryanston 10 years from now” will look like. Our very boring prediction – by 2029, assuming the economy does not fall off a cliff, you can expect a 15% increase in GLA, to end up with 811.8K square meters of rentable office space. This equates to 105.8K extra square meters of developed property (say R2.5B – R3.0B of development), and approx 7.1K extra “bodies” in the node.

About the author

Related posts

Solar for CRE
Industry Intel and News
Solar for commercial real estate

For a South African CRE industry buffeted by Covid, weak economic growth and public sector incompetence, is solar power too good to be true? Is solar indeed one of property’s unicorns – a positively geared investment with increasing cash flows – and what are the risks associated with it?

Automate CRE data work
Industry Intel and News
CRE data: outsourced

Apple, one of the most profitable businesses in the world, is the king of outsourcing. Its brains reside in California, while its grunt work is spread to specialists all over the world. Is CRE missing a trick? Like the strategic minds at Apple, can it farm back office services to cheaper, specialist hands – and drive greater profitability?

Black Pepper Properties commercial property
Industry Intel and News
White paper: the professional CRE brokerage of tomorrow

What is the role of early adopters in our CRE industry? What characterises these individuals, and how can they help me? Simon Black MRICS, an experienced professional, is one of these. Always seeking the latest tools and innovation, clients can trust them to apply best practices, while the industry follows their lead.

Leave a Reply

Your email address will not be published. Required fields are marked *

Fill out this field
Fill out this field
Please enter a valid email address.
You need to agree with the terms to proceed