


Why do proptechs in emerging markets fail? How to win instead
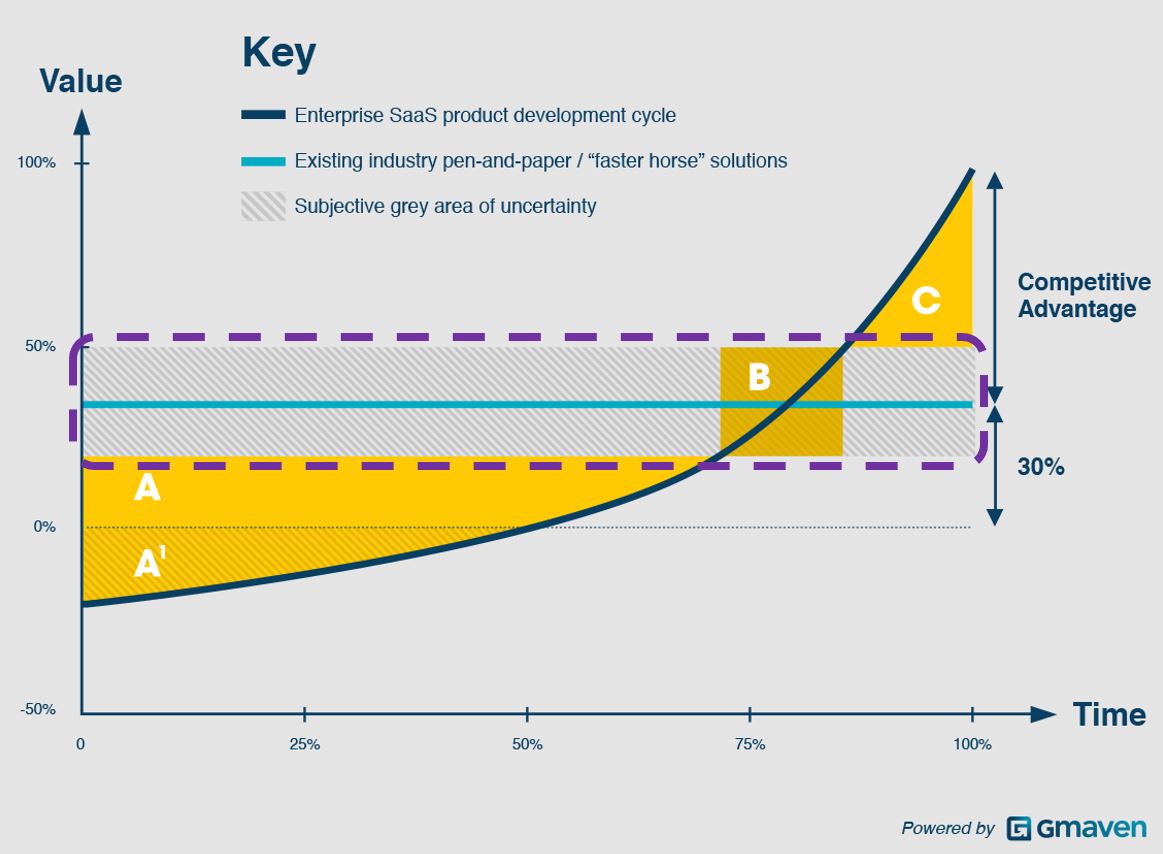
Startups that seek to fuse enterprise SaaS and data (proptechs) are hard. Attempting proptech in an under-funded, under-sized market dials up the difficult. Is it impossible? No. But it will be easier if you know the pitfalls upfront, and can plan for them
