

A polygon is a shape with at least three straight sides and angles, and typically five or more.
A triangle is the simplest polygon.
Outlines on a map, creating shapes that outline data assets like:
- Properties,
- Suburbs,
- Commercial nodes
- CRE clusters
- Cities,
- Provinces,
- Countries, or
- Continents
…are also all polygons.
A polygon is an incredibly useful way of describing a collection of properties on a map.
And polygons can be customised to your lens.
See example below: CRESTA zone polygons (used in insurance) are in red. In contrast, mutually exclusive, collectively exhaustive (MECE) commercial property clusters are in blue.
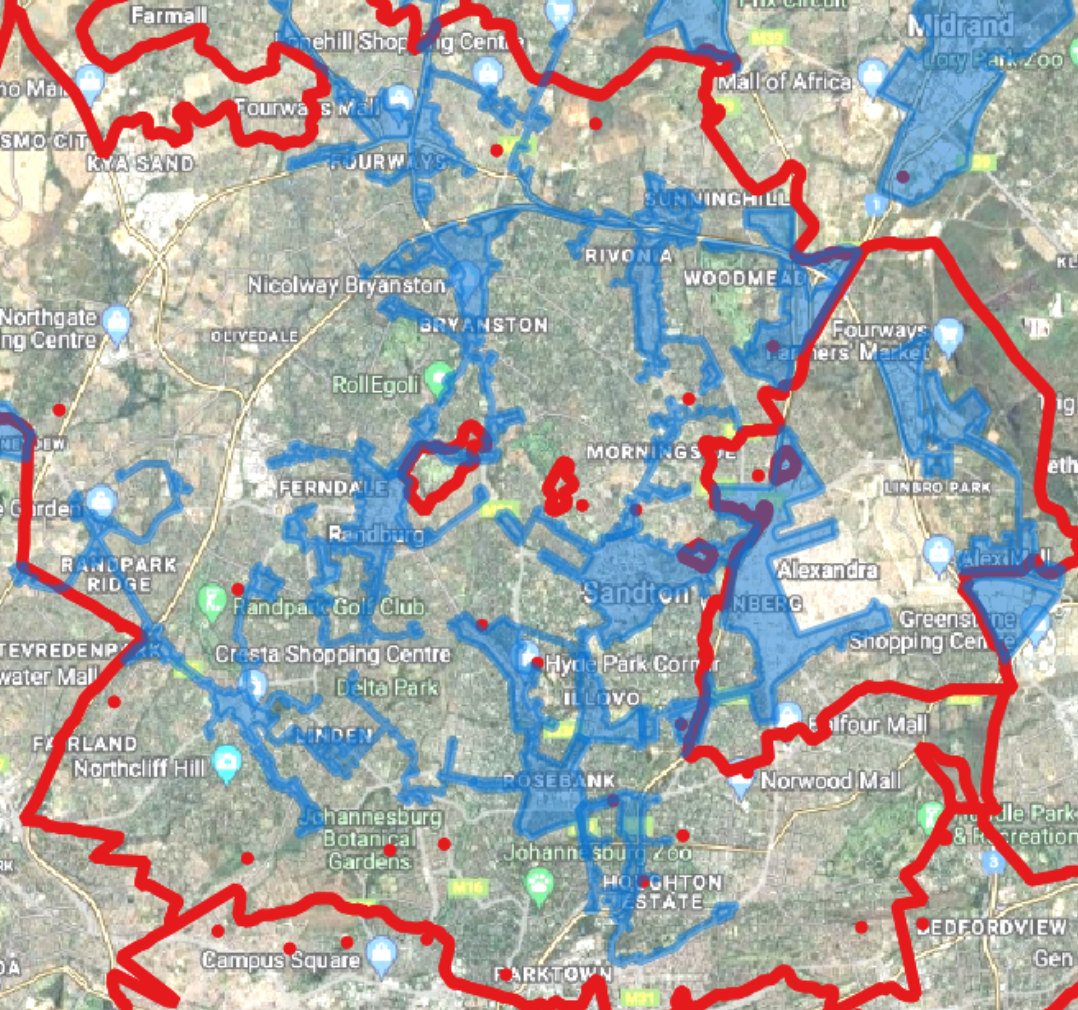
(Note how CRESTA’s SA postal code-driven polygons defy MECE principles)
This fusion of geospatial data and commercial real estate (CRE) data is a great example of data becoming relevant to a wider audience of strategic decision-makers. See this article for a practical example of how polygons are used by business.


