CRE research: Rosebank office vacancies Aug 2019

Rosebank is featured in this popular research article format. In addition to the normal format we cover the performance of Africa’s first WeWork, and, for a first time, clarify definitions of vacant space. We then cover the standard nodal detail (nodal definition, snapshot, comparatives, vacancies by grade, asking gross rentals by grade and comparatives, timing of vacancies coming onstream, and…
Rosebank office vacancies research

W Edwards Deming:

“In God we trust, all others bring data” 


The high density Rosebank node – along with Sandton and Randburg – can be regarded as one of the “new” CBDs of Johannesburg. Rosebank is serviced by the Gautrain on its eastern border, and located in between the north-to-south road arterials of Jan Smuts Ave and Oxford Road (becoming Rivonia Road further north).

Rosebank is surrounded by high end residential suburbs: Saxonwold, Houghton Estate, Melrose and Melrose Estate, Dunkeld and Dunkeld West, Parktown North and Parkwood.

Rosebank as an office node is currently seeing one of the highest high density residential developments rates in the country. Whether through residential new builds, or apartment recycles, or office-to-resi conversions, its office workers are being serviced with options for a great address in a (generally) small home.

This article covers three topical items of interest:

  1. The WeWork phenomenon and Rosebank,
  2. Definitions of vacant space,
  3. The numbers: vacancies, asking rentals, space coming onstream and deals

For starters – what is Rosebank?

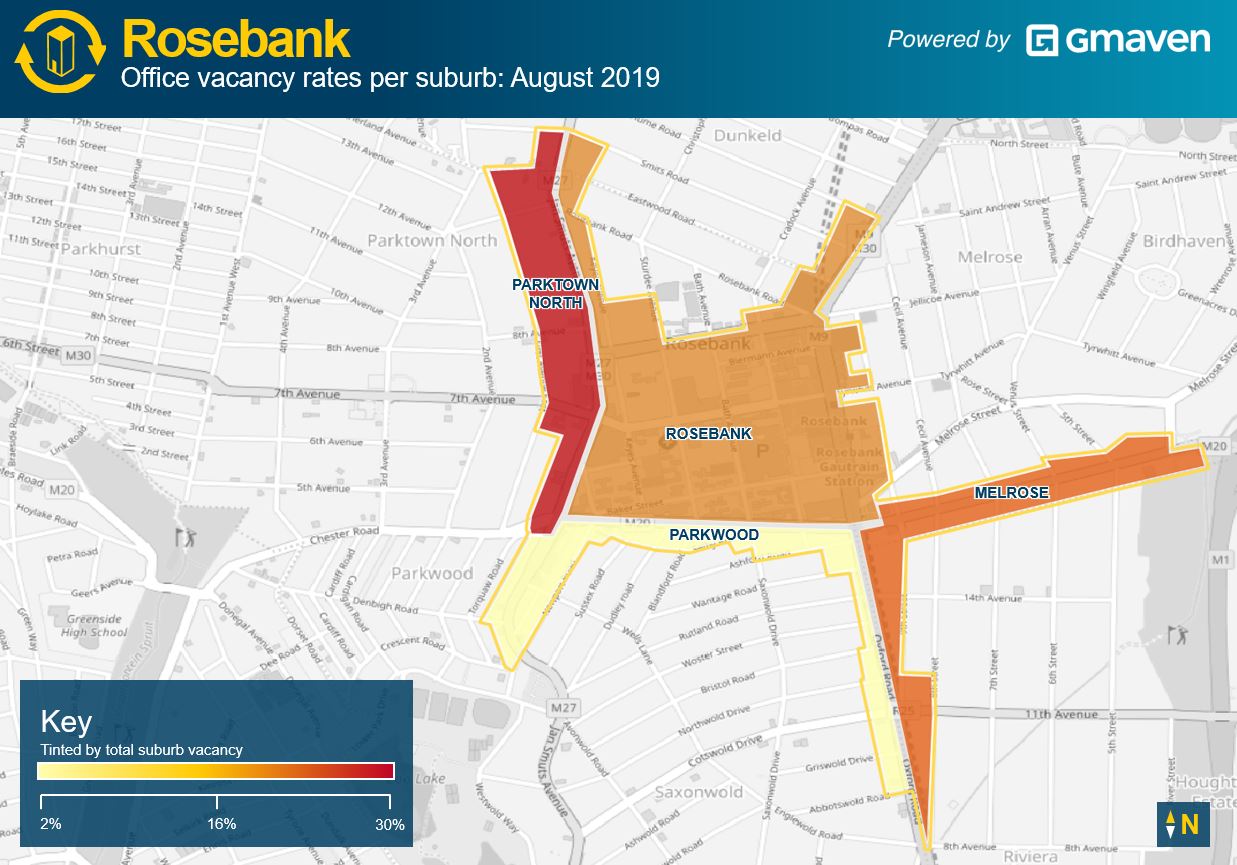
Rosebank, for purpose of this exercise, is defined by the following shape (polygon) – image below.

If you click on the button below left, you can see Rosebank in Google Earth. (To view, you will need Google Earth on your machine. If you don’t have Google Earth, the button to download it is alongside / on right)

CRE Rosebank vacancies research

The above shape, roughly linked to the 4 suburbs detailed above, and encompassing, in total, 184.7 hectares in extent (1,846,567 sqm), of which 68.3 Ha is office, contains however only 194 office properties (Note: this is commercial real estate (CRE), and it is complex – one property can comprise many buildings, each building can comprise many units or “pockets” of space).

More detailed commentary on the Rosebank definition and image¹ is available in the Notes section below. (For interest’s sake we have added % office vacancies² per suburb to the graphic above.)

1. Rosebank and WeWork

The much-hyped WeWork (estimated value $47B) IPO is happening in a couple weeks’ time in September. Rosebank is home to WeWork’s first location in Africa!

Thus it is fitting, in our analysis of Rosebank, to understand how WeWork has performed in its beachhead site.

First some context:

  • For starters, WeWork has launched into South Africa in a relatively “soft” period in our commercial real estate (CRE) property.
  • At 12,800 sqm (137.7K SqFt) over 6 floors, the space occupied in Redefine’s Rosebank Link building is roughly 2x larger than WeWork’s standard first site in a foreign market. Bold move!
  • Thirdly, WeWork generally targets a 60% occupation rate on site opening.

So how did site no. 1 in Africa perform? WeWork, which opened 1 Aug, started marketing space in February this year. Within 6 months all space had been signed up – with a waiting list. Thus WeWork is 100% full, with the overflow of potential JHB customers currently being referred to Sandton, and two additional sites in the vicinity of Rosebank rumoured to be under negotiation.

WeWork’s 12,800 sqm in recent leasing deals ranges from Naspers, Redhat, Platform 45, OpenVantage and a major ICT company, with the balance being occupied by local smaller businesses.

2. Housekeeping – definitions behind the numbers

Before we get into the numbers, let’s dedicate some time to academic rigour. If you’re not into the detail, feel free to skip this second section, and move on to the third.

For starters, academically, no definition is right or wrong. However, for us, it is critical that data is stored in a way that allows various space definitions to be applied.

Why should we care? A short context-providing preamble

Imagine there was a landlord, let’s call her Landlord A, who owned a property in a large node, with one of her properties being the only defined vacancy in the node. This pocket, made up of say 3,000 sqm, sub-divisible down to 500 sqm, was available immediately. However, despite this, Landlord A was not able to let that space. Worse, inexplicably, in parallel, every quarter Landlord A heard that deals, ranging between 500sqm and 3,000 sqm, were being done in the node. But, not with her. Yet she is the only vacancy. How? And why?

Sound practical reasons for this exist. Those tenants in signed leasing deals were instead going to any of one of the following:

  • Space that is not available immediately (like hers), but instead is becoming available in say 2 weeks or 2 months, or
  • Space that is available for sub-lease (vs available to let directly by the owner), or
  • Space falling slightly outside a geographical definition of the node

These 3 factors explain why the landlord’s space is not being leased. The landlord is actually operating in a more competitive market. While one definition has the node as only 3,000 sqm vacant, the vacancy is actually greater. A wider definition supports this more competitive reality.

Reconciliations from (Gmaven) wide to narrow definition

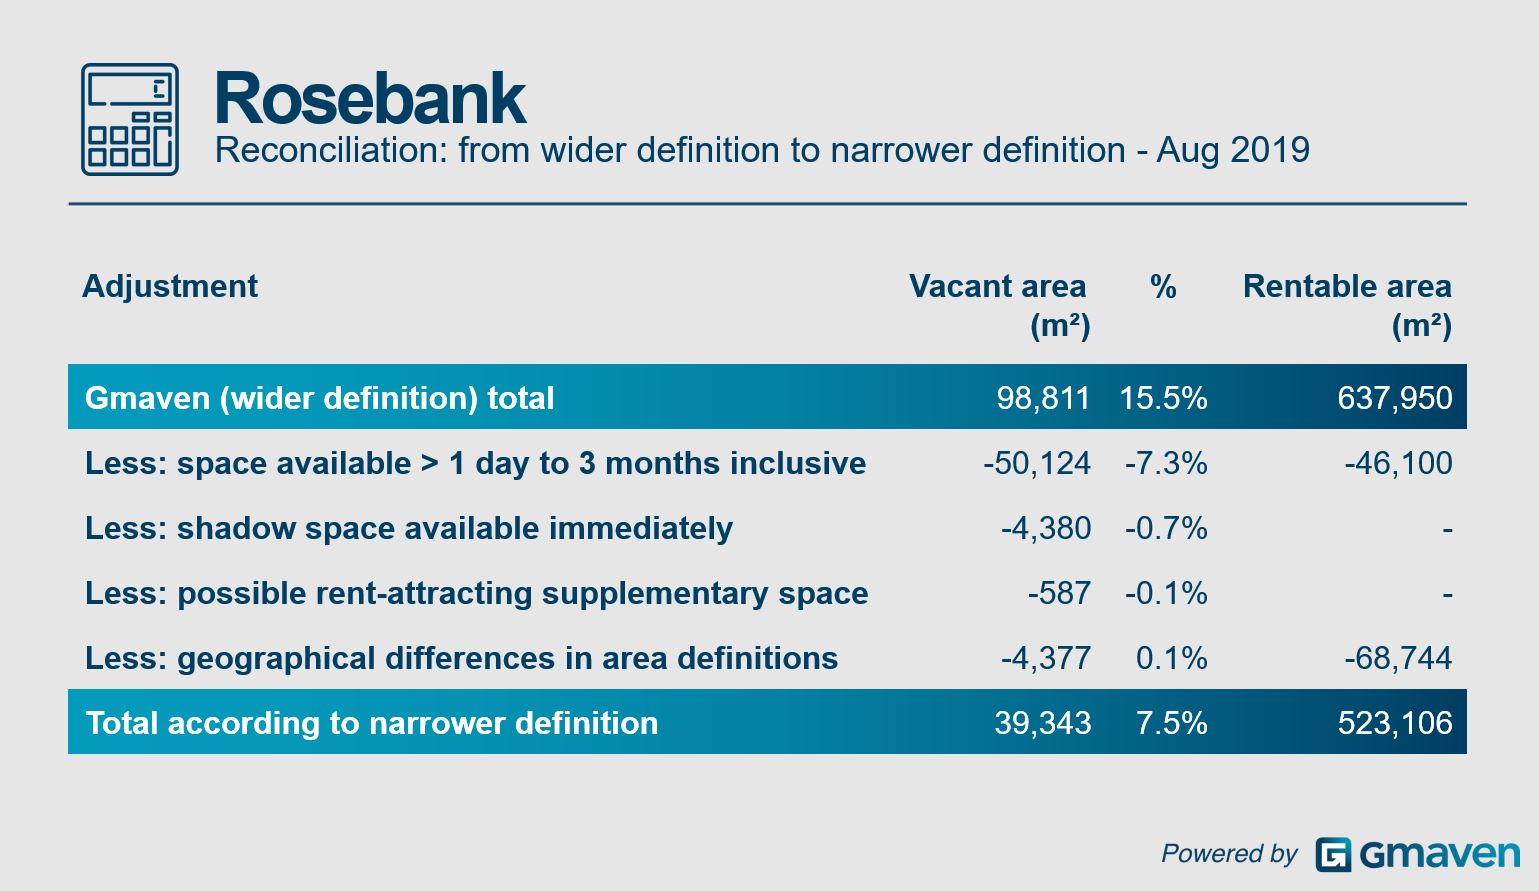
Taking the above into account, the below table walks us from a wider definition, taking the above competing options into account, through to a more narrow definition.

Rosebank office vacancy definition

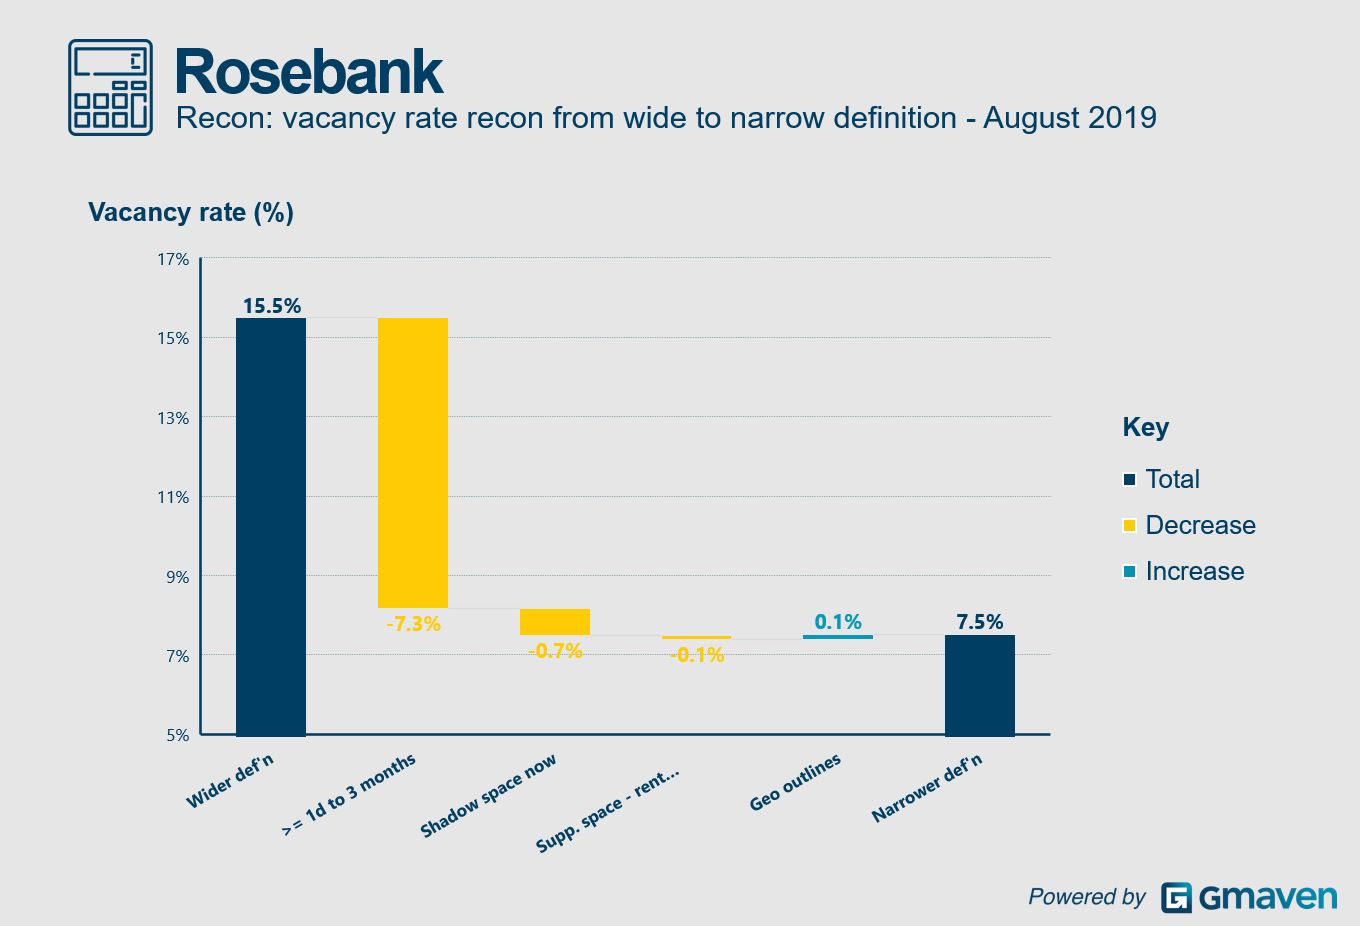
Here is the same information, in a waterfall chart:

Waterfall chart Rosebank office vacancies definition
Gmaven’s vacancies definition

So, as is obvious from above, Gmaven’s vacancies definition is wider, expanding its filter for the following

  • Space available beyond immediate, extending up to 3 months from now
  • Shadow space (i.e. sub-leases)
  • Gmaven’s geographical definition of Rosebank is as per above

(Gmaven also includes a tiny fraction of complex space where its definition / categorisation according to vacancy schedules is unclear (i.e. it could be deemed to be “rent-attracting supplementary space“, or conventional gross lettable area))

3. Rosebank office vacancies: snapshot now

Rosebank office to let research

One point on the above vacancy rate… If two on-risk developments (totalling 46.1K sqm ) coming onstream shortly are ignored, total Rosebank nodal vacancies would plummet to a (currently) industry-beating 9.1%. See the waterfall chart above “>=1d to 3 months”.

Definitions for “Total rentable office space”³, “Total area available for leasing”⁴ and “Total space coming onstream”⁵ can be found in the notes section of this article. In simple terms, total area available for leasing can be understood as the answer to this question: assuming a theoretical spike in demand and frictionless occupation, how many square meters could incoming tenants sign to occupy within 3 months?

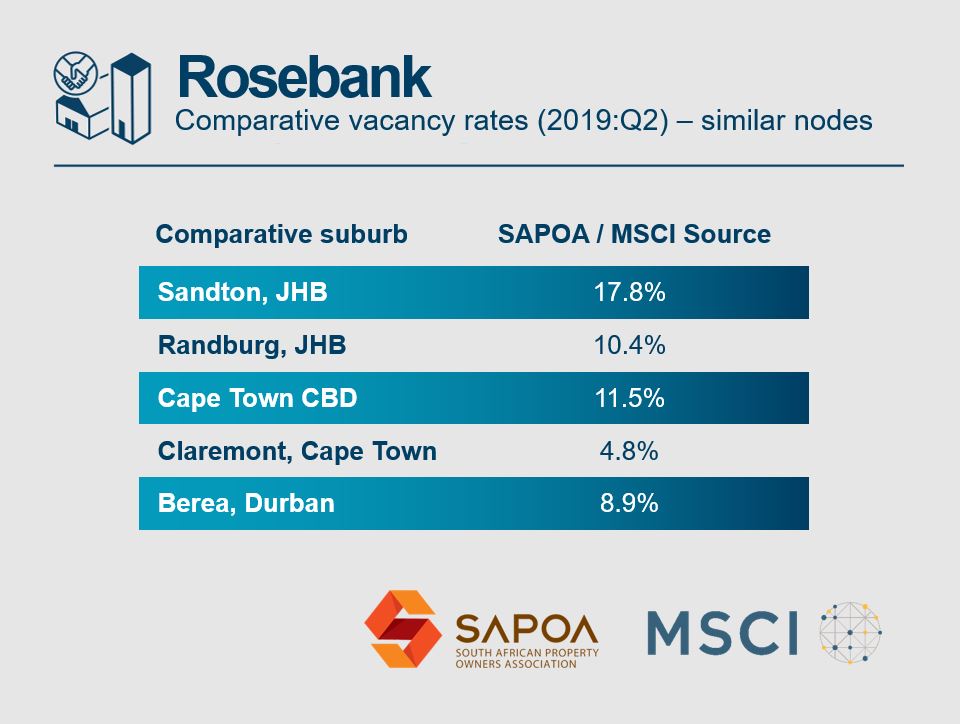
So how does this compare to other nodes? Comparative nodes to Rosebank (relatively established, central business district, high density, close access to quality residential property) score the following (more “narrow” definition) on their vacancy rates:

Rosebank CRE office alternative suburbs

Comparative data source: MSCI Real Estate, SAPOA Office Vacancy Survey 2019 Q2 July: Vacancy rate – Area Available For Leasing

Unpacking vacancies by grade

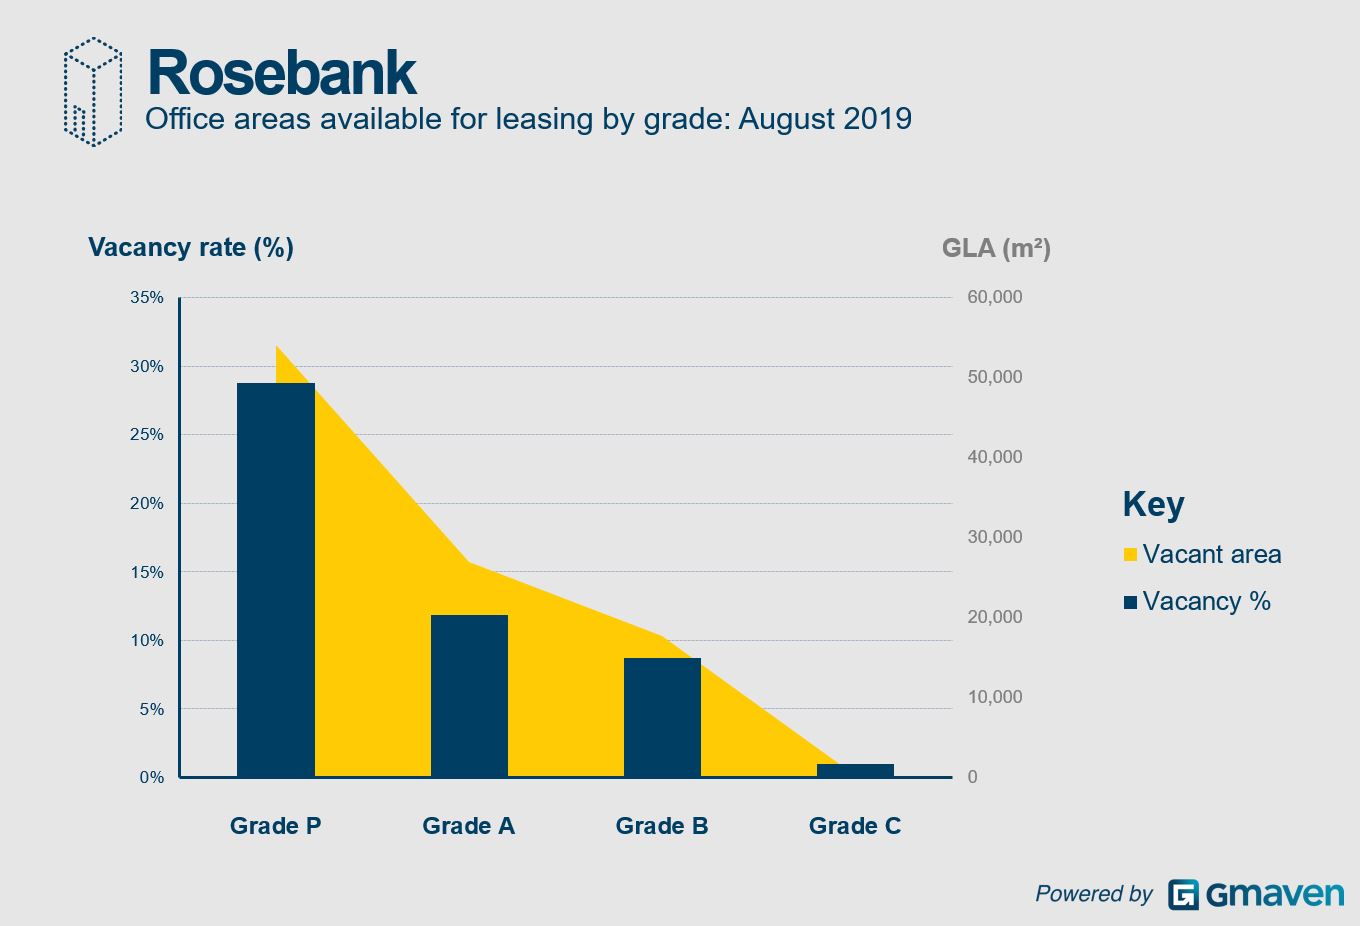
Not all space is the same. In the graphic below, Rosebank vacancies are broken down by grade (“quality” to CRE industry outsiders)

Rosebank CRE vacancies by quality

The high weighting of P grade (premium grade) vacancy is due to two properties, separately owned, shifting 35,161 sqm and 10,939 sqm of space onstream in the next 3 months. While deals on this space are under negotiation, nothing yet has been concluded. Excluding the above, P grade vacancies for the next 3 months are hovering at a 4.2% vacancy level.

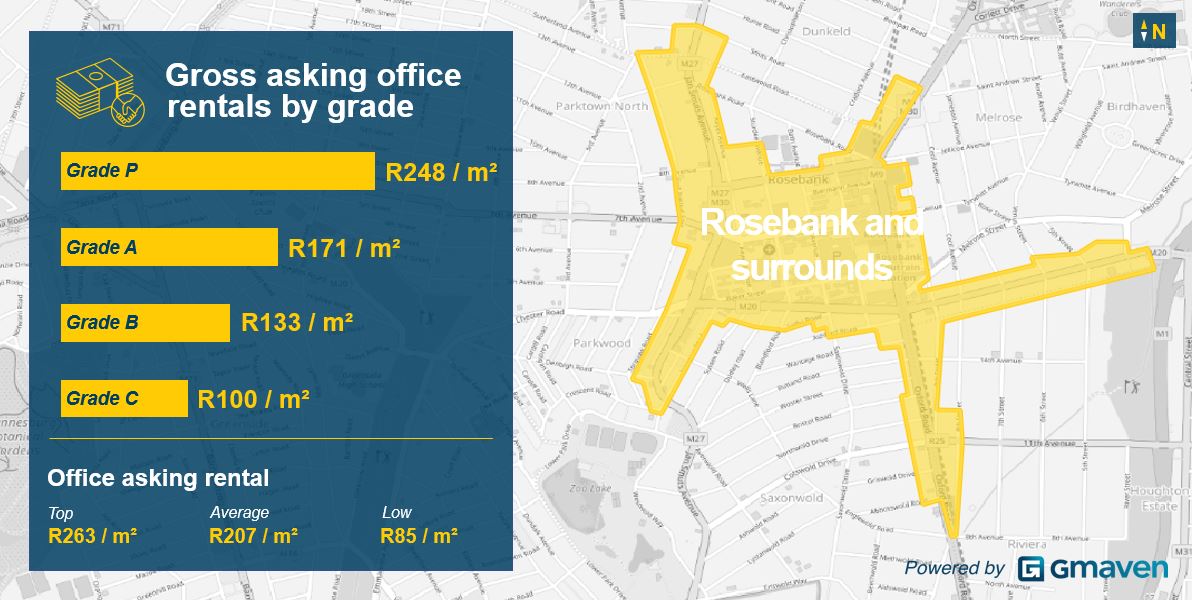
Asking gross rentals

The above term is exactly that – what the landlord is asking. In periods of higher demand and lower supply, rentals are concluded at asking levels. In softer environments such as these, landlords may look to structure leasing agreements, resulting in rentals below asking.

Gross rental⁶ is defined here, and at the foot of this article.

Rosebank office rentals CRE research

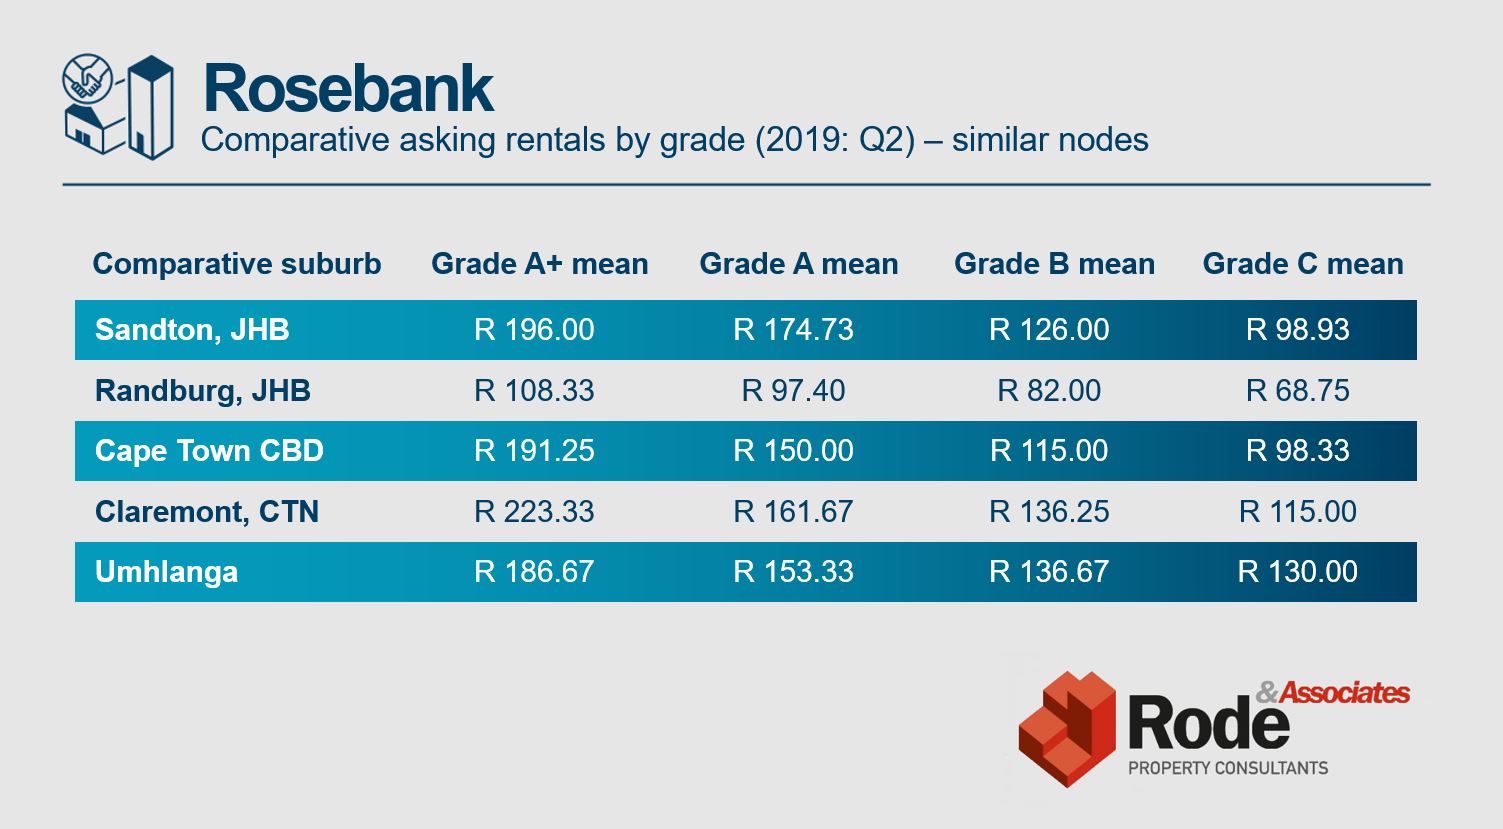
Comparative nodal information on rentals can be found below

Bryanston office rentals comparison

Source: Rode’s Report 2019:2 Office rentals

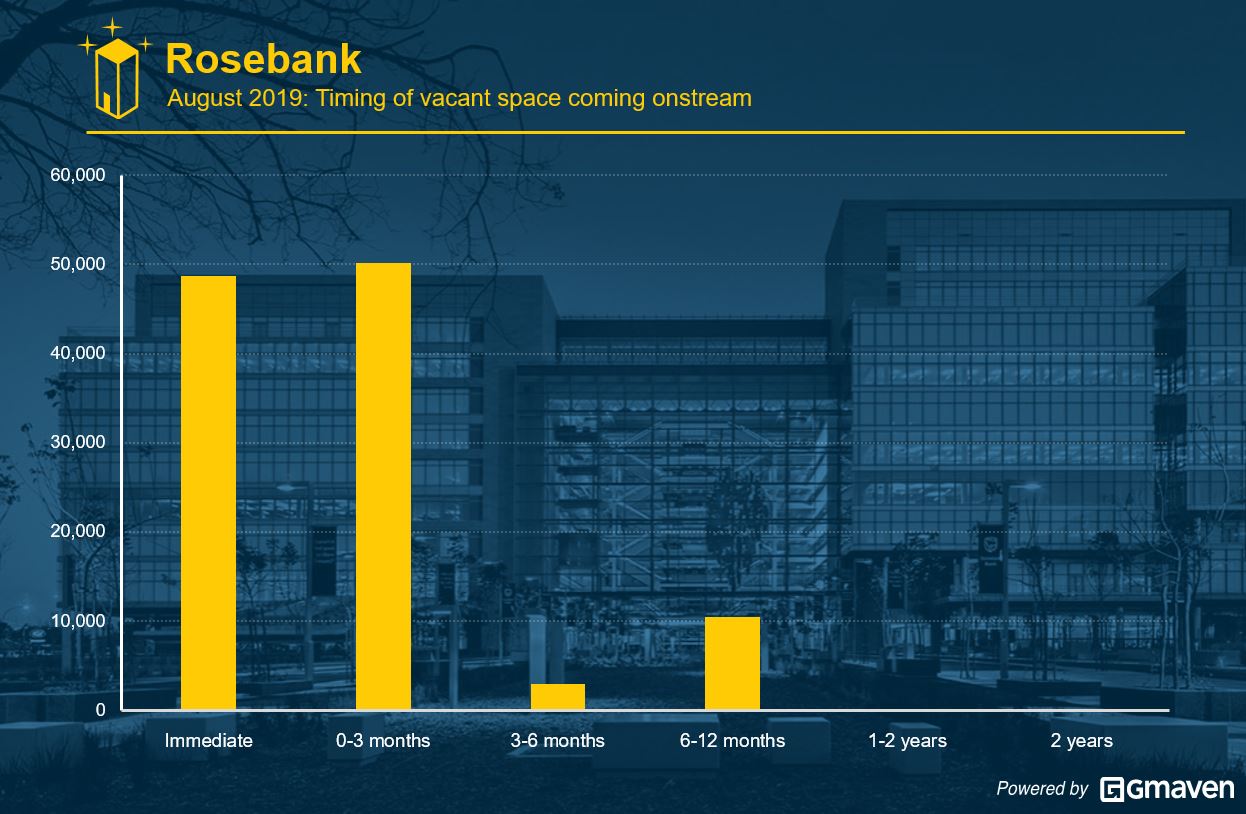
Timing of vacant area coming onstream

The image that follows talks to new supply coming onstream in future. Only on risk / confirmed developments are displayed below. Tenant-driven developments are excluded.

From the chart below, while significant developable bulk exists Rosebank, property owners are not developing new properties on risk. Instead such land owners are exercising prudence and waiting for tenants to “kick start” developments.

Rosebank office future developments

The “now” date is 26 August 2019. Thus 0 to 3 months refers to all vacancies coming onstream before the end of November 2019. 3-6 months is all space becoming available from late November to late February 2020.

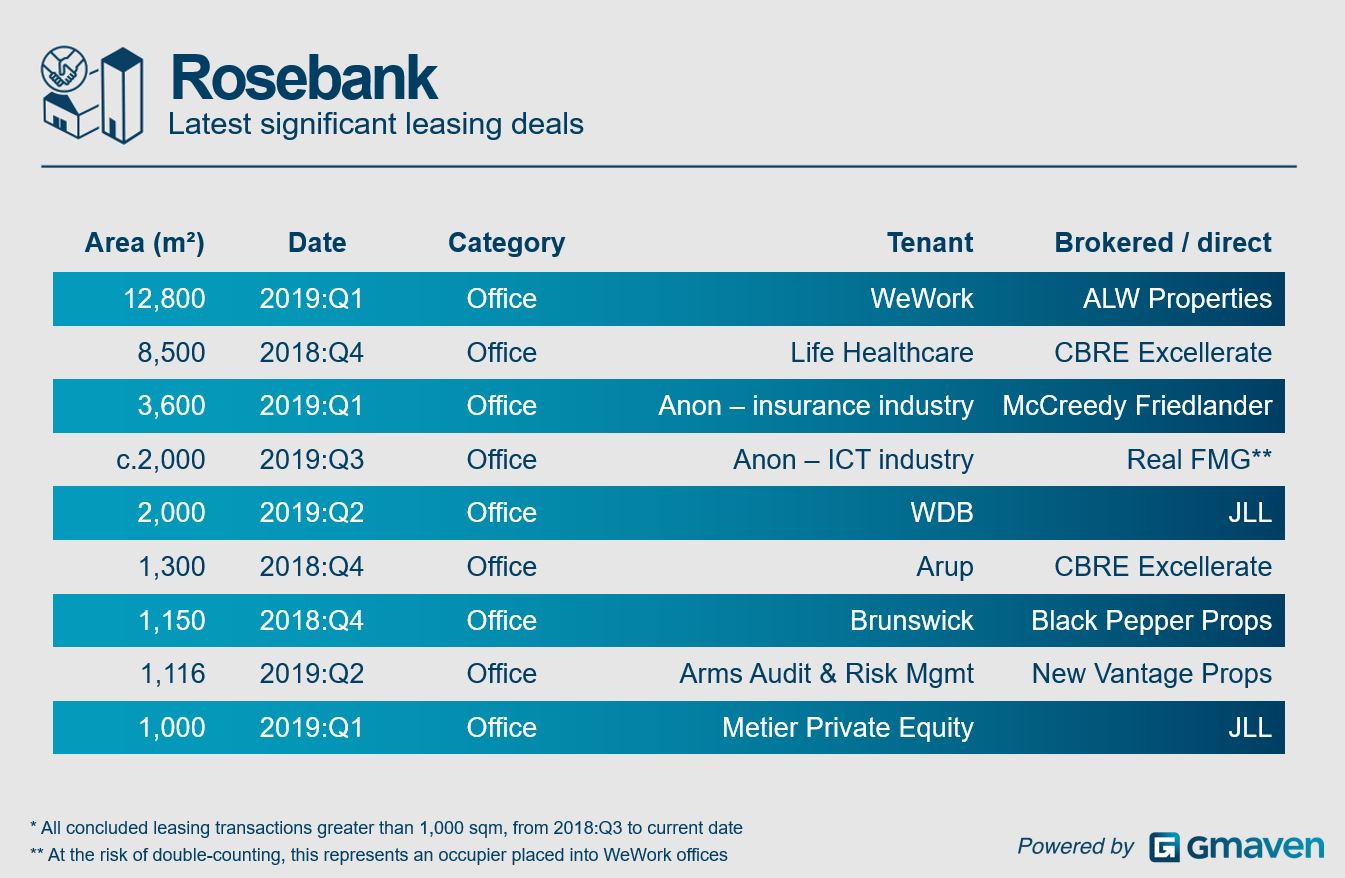
Deal flow reducing Rosebank office vacancies

The following table provides all known significant leasing deals, concluded in Rosebank from 2019:Q4 onwards. To emphasise, this excludes the majority (by count) of leasing deals closed for space smaller than 1,000 sqm.

Rosebank CRE office leasing deal makers

The above excludes certain significant deals underway, but not disclose-able.

For more information on the brokered deals above, you can contact the relevant industry professionals below:

McCreedy Friedlander Gmaven

McCreedy F. team

Accreditation and thank you

Commercial real estate remains an information-opaque industry…

Thank you to Rosebank area experts as follows:

  • Jane Parker of Broll for providing detailed and comprehensive information on private stock and shadow space (sub-lease opportunities), and stress testing the accuracy of granular vacancies data.
  • Simon Black of Black Pepper Properties, for identifying further shadow space, and also evaluating the accuracy of granular vacancies data.

The valuable comparative data provided by MSCI / SAPOA and Rode is acknowledged and appreciated. As is the calibration of our term definitions and “acid testing” of our logic – thank you Kerry Millar of RealFMG.

We have done our very best to ensure complete accuracy. However, in the instance of omissions or errors, these are all our own.

Notes

Methodology

Gmaven processes 95% to 100% of public domain vacancies (inventory) in South Africa – at present an operationally intimidating 6.7M square meters of vacant leasable area, covering 9.4K units. As is obvious above, this data is aggregated and anonymised for consumption by third parties and industry outsiders. However, for professionals familiar with the Gmaven system, all data is stored at appropriately high levels of granularity (from tenant installation allowances, to escalations, to complex spaces, to breakdown between expense types and obligations).

All vacancies are stored within properties, and all properties are assigned, among approximately 800 other fields, fields such as a property grade, total rentable area, primary property category and co-ordinates. Every vacancy is time-stamped, and all data is stored within and queried from a data warehouse. All data in this warehouse is subject to quality processes and audits – from rigorous data validation and exception management to reconciliations. Further, all vacancies data is tested for duplication property fund side. This necessary (but misleading) practice by property funds has arisen because certain broker vacant space search algorithms / data structures do not handle sub-divisible or combinable units.

For those technically inclined, we run a data vault warehouse which feeds into a Ralph Kimball warehouse. The data is queried through an OLAP service.

¹ Rosebank geo definition

Polygons inevitably will cleave suburbs (i.e. will not always include suburbs in entirety). The “casualty” (cleaved suburb) in this definition is Dunkeld and Parktown North to the north and west, Melrose to the east, and Parkwood to the south.

² Office vacancy

Office vacancy % = office space available for leasing divided by built office space’s total rentable area. The time parameter is from now to 3 months inclusive.

³ Total rentable office space

Means the total area available for occupation, within 3 months, of all office properties. This would exclude those properties ear-marked for redevelopment to hotel or residential, or those sites where development will be user-driven.

⁴ Total area available for leasing

This definition is important. It is defined as all space (currently built or in development) available or becoming available for rent in the next 3 months.

Leasing processes can take, on average, 6 months from commencement to conclusion. Consistent with this, it is our opinion that space, not available immediately, but falling within the now to 3 month availability window ought to be considered for inclusion into total area available for leasing. For purposes of this report, 50,124 sqm of this space is included in the 98.8K sqms.

The above includes:

  • Space to let by landlord,
  • Space becoming vacant as tenants terminate leases,
  • Shadow space (such as sub-leasing opportunities)

It excludes:

  • All space becoming available for rental after 3 months,
  • Space due to be occupied (high probability) by tenant/s arriving from outside of the node,
  • Tenant-driven development sites,
  • Small space that is not distributed to brokers or the public for leasing,
  • Space that is leased from the landlord for purposes of flexible office space (but, in the on-leasing of such space, flows back into the vacancy pool) , and
  • Space that is currently under-sweated from a space efficiency ratio (i.e. acting as a “shock absorber” to increased demand). For example: a tenant is occupying 1,000 sqm with 45 staff. If their staff complement increased to 60, this example tenant could accommodate this increase in staff within their existing 1,000 sqm

There is a grey area between Rentable Area (offices, support area lobbies, circulation space common areas) and Supplementary Areas. While balconies, storerooms and parking bays can attract rental, technically none of these ought to be counted in the Rentable Area. For purposes of this exercise, where office space cannot be separately rented without these Supplementary Areas (i.e. “Complex Space”), these supplementary areas have been included in total area available for leasing. The total of such supplementary space: 1,834 sqm (various available time bands).

⁵ Total space coming onstream

Means all space becoming available after 3 months. This space is either built (with tenants terminating their leases), in construction and not pre-let, or due to be constructed on risk. All tenant-driven developments are excluded.

⁶ Gross asking rentals

All asking rentals provided above are gross, and exclusive of VAT. Gross rental (more info here) can be defined as those rental and related expenses payable directly by the tenant to the landlord. This generally excludes, for example, rental-related expenses such as utilities (lights, water and sewerage), or internal cleaning. To deal with the elephant in the commercial real estate room, gross rental between owners can vary. Sometimes other “grey area” property-related expenses are paid additionally by the tenant, other times these are bundled into the gross rental number. Example expenses are: aircon and internal maintenance, additional security, elective generator levies, additional cleaning and hygiene.

Further to above, with rental holidays, tenant installation allowances and other tenant incentives, gross asking rentals can be hard to compare (on an “apples for apples” basis) between buildings. A skilled CRE professional will be able to navigate you through the financial and legal complexity.

To keep Rosebank office vacancies assumptions down, units to let providing only net rentals (4.6% of total) have been ignored. Average rentals have been weighted by area available for leasing. In event of complex spaces (spaces that are not separately rent-able) – for example including terrace, storage, balconies – differing rentals across space sub-categories have been weighted based on area. Non-office space (e.g. storage) rentable separately has been excluded

About the author

Related posts

Solar for CRE
Industry Intel and News
Solar for commercial real estate

For a South African CRE industry buffeted by Covid, weak economic growth and public sector incompetence, is solar power too good to be true? Is solar indeed one of property’s unicorns – a positively geared investment with increasing cash flows – and what are the risks associated with it?

Automate CRE data work
Industry Intel and News
CRE data: outsourced

Apple, one of the most profitable businesses in the world, is the king of outsourcing. Its brains reside in California, while its grunt work is spread to specialists all over the world. Is CRE missing a trick? Like the strategic minds at Apple, can it farm back office services to cheaper, specialist hands – and drive greater profitability?

Black Pepper Properties commercial property
Industry Intel and News
White paper: the professional CRE brokerage of tomorrow

What is the role of early adopters in our CRE industry? What characterises these individuals, and how can they help me? Simon Black MRICS, an experienced professional, is one of these. Always seeking the latest tools and innovation, clients can trust them to apply best practices, while the industry follows their lead.

Leave a Reply

Your email address will not be published. Required fields are marked *

Fill out this field
Fill out this field
Please enter a valid email address.
You need to agree with the terms to proceed