Johannesburg blue chip office node performance

An efficient snapshot of South Africa’s office property market as at October 2019 – using, as a proxy for the larger industry, the performance of three blue chip nodes in Johannesburg. We also reveal two new-to-industry metrics: average space density, and performance by owner type.

“When America sneezes, the whole world catches a cold”

(To be fair, this quote, initially referring to France, originated from Klemens von Metternich, Austrian Foreign Minister from 1809 to 1848)

Similarly, the performance and state of Sandton, Bryanston and Rosebank – as representatives for prestigious office nodes in South Africa (see here) – are useful indicators of SA’s blue chip office market as a whole.

Going more granular, the above three nodes are useful barometers** for the state of Johannesburg’s office market as at Oct 2019.

(** With no disrespect intended to other major office nodes, by SAPOA rentable area size, within Johannesburg – namely: JHB CBD (1,884.0K m²), Braamfontein (444.6K m²), Parktown (439.6K m²), Randburg (430.7K m²) and Woodmead (429.6K m²))

First, some fundamentals – how do the nodes compare?

Bryanston is your classic South African decentralised, high quality node. Not pedestrian friendly, and with generally reasonable access to retail, it is surrounded by high income residential suburbs, and transport-serviced by road.

Sandton and Rosebank are similar blue chip office nodes: they boast access to rail, enjoy high density zoning, and are supported by high density residential – conducive to a live-work-play environment.

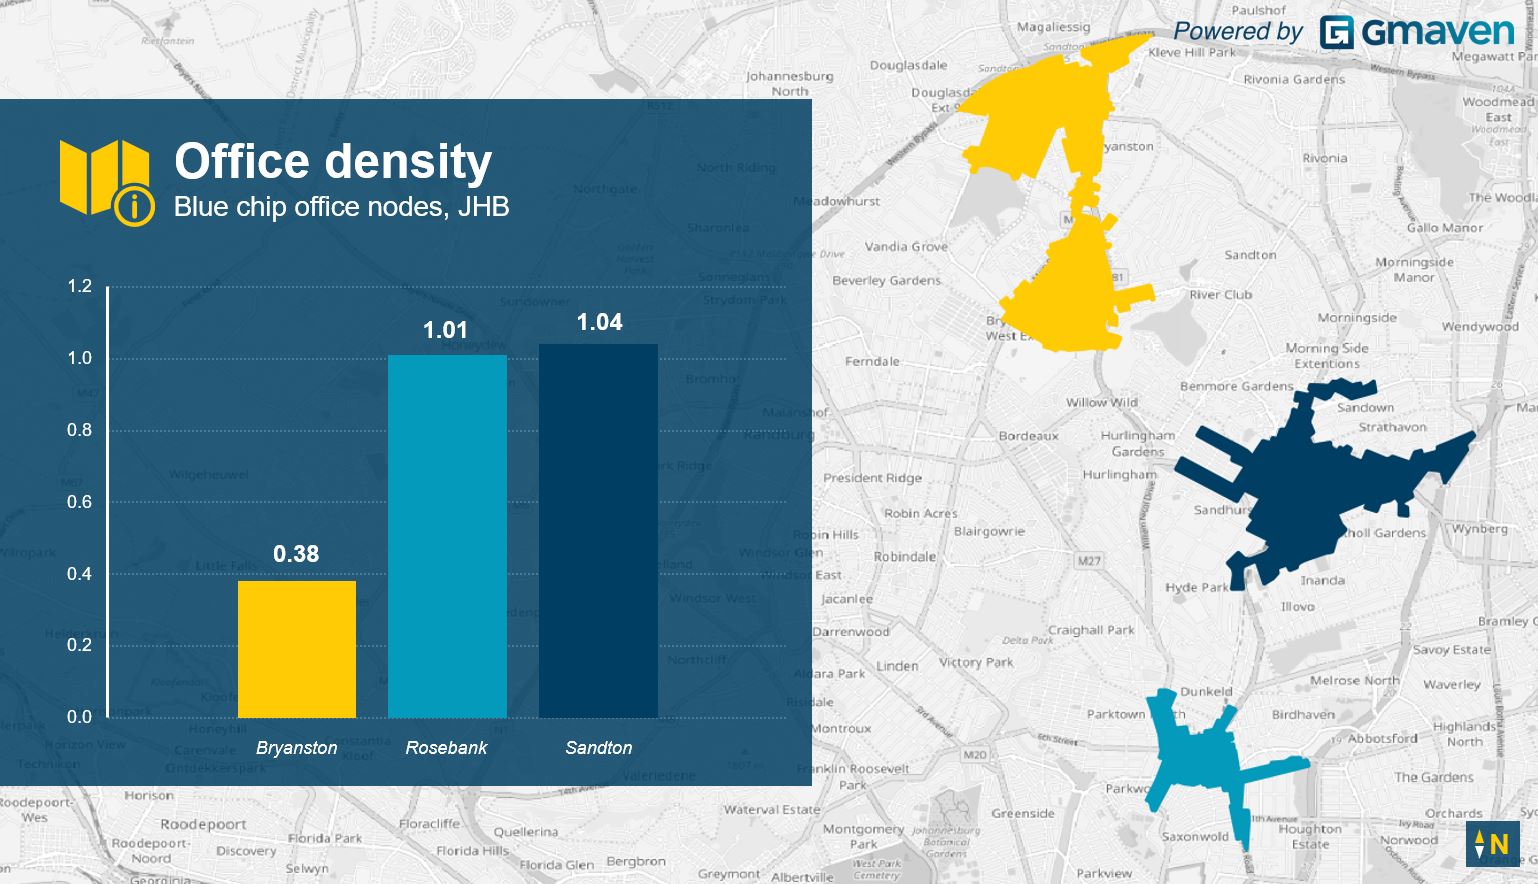
This below image explains how developed or undeveloped the nodes are (calculation below: office rentable area divided by land use for office).

In other words: for every square meter of office land, how many square meters of rentable area has been built. For example, looking at below, for every 1 m² of land dedicated to office, Bryanston has 0.38 m² of office built)

JHB office property density

In summary, the sprawling Bryanston office node (188.3Ha) covers almost 3 times as much space as Rosebank (63.4Ha). But its built office space is only 11% larger (707K m² vs 638K m²). Sandton chugs along at 2.1M m² and 197.0Ha).

How are the nodes performing, and performing against each other?

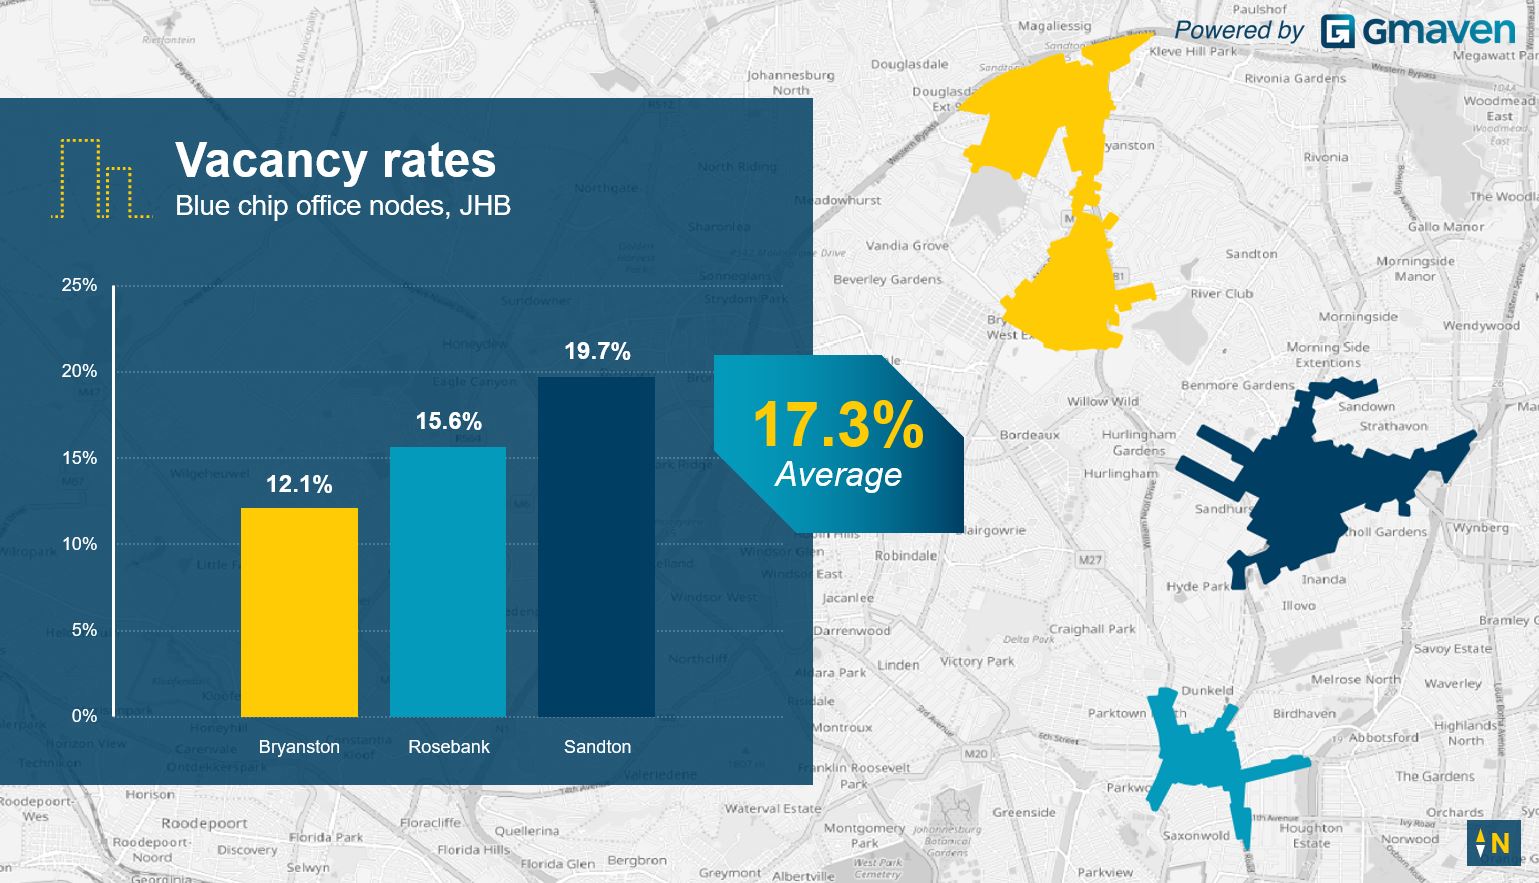
Very simply, these are the vacancy rates according to the wider definition¹ (wide and narrow vacancy definitions is unpacked at the foot of this)

Commercial property blue chip office vacancy JHB

Sandton’s trendline of reducing vacancies is looking good – but vacancy levels at 19.7% are still high.

Rosebank’s 15.6% vacancy can be attributed to recent on-risk developments coming onstream. Adjusting for only two properties, total Rosebank vacancies would plummet to an industry-beating 9.1%! (46.1K m² has formally come live in the Rosebank node in the last 6 weeks)

Bryanston’s vacancy rate of 12.1% is below market – in the current climate, for Gauteng, the node is performing well.

Let’s drill deeper into the vacancies…

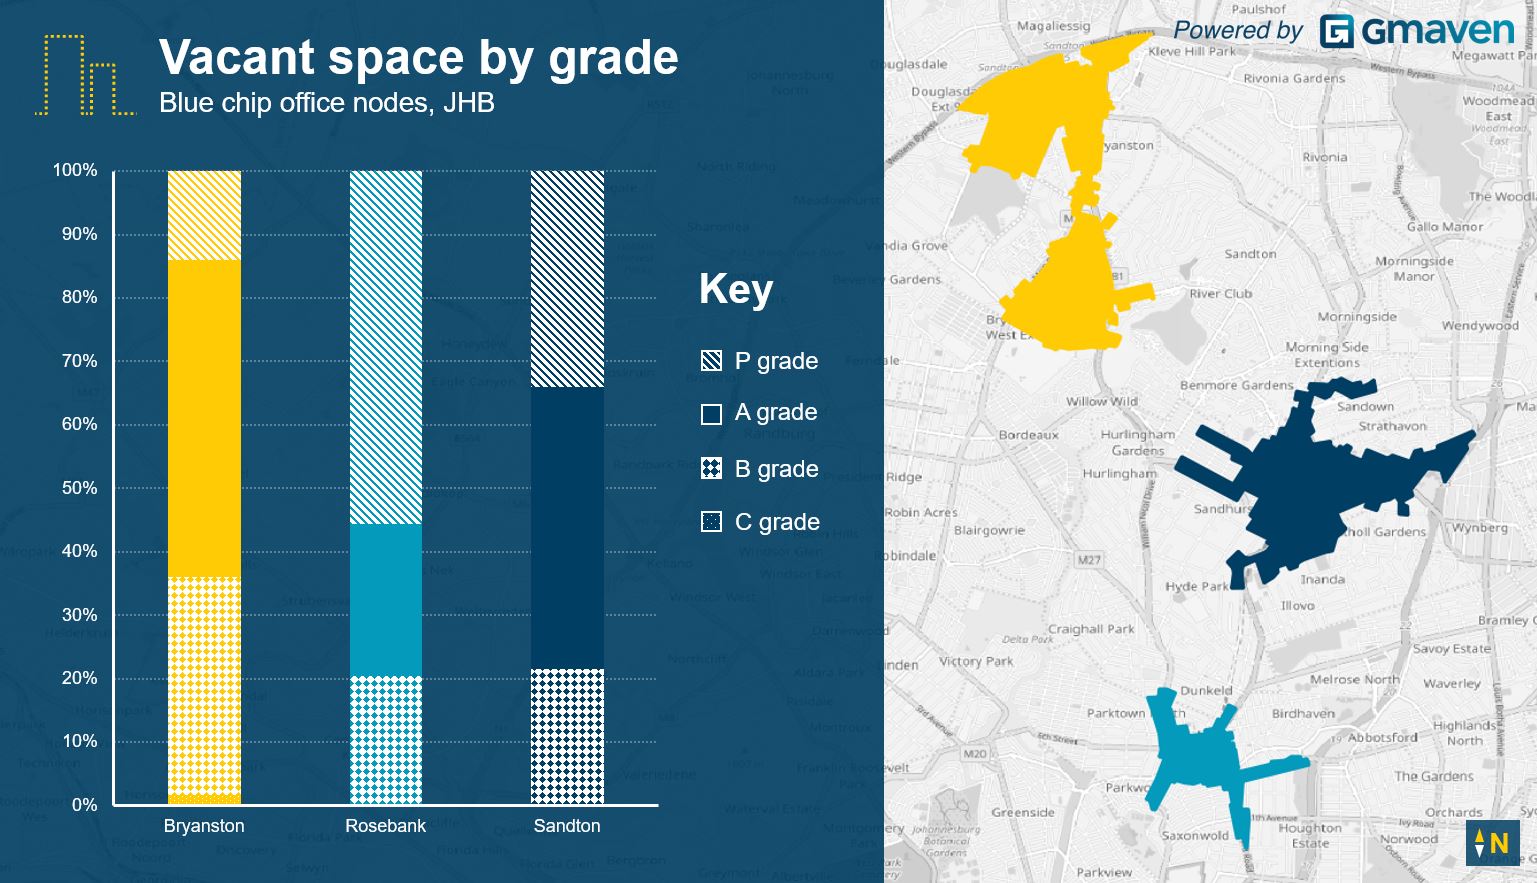
How are those vacancies made up? (Grade by totals)

…Which properties are pulling their weight, and where does there appear to be an over-supply in blue chip office nodes?

Blue chip office to let by grade commercial property

The comparatively low level of Bryanston vacant P grade space points to low levels of recent on-risk development (new builds tend to be spec’d out as P grade). In turn, this can be explained by the following

  • Mainly: the Bryanston node’s zoning provides low bulk rights. Building is an economies of scale game. This zoning handbrake means developers are not tempted by the relatively lower cost per sqm, into squeezing more space into their new builds,
  • Mainly: low levels of P grade development in Bryanston (5% of total) – due to lower take up of this P grade space (currently P grade is 28.6% vacant – more info below), and
  • Partially: the generally conservative nature of Bryanston property owners: 49% listed, 24% private, and 24% owner occupier (vs 45%, 22% and 22% respectively)

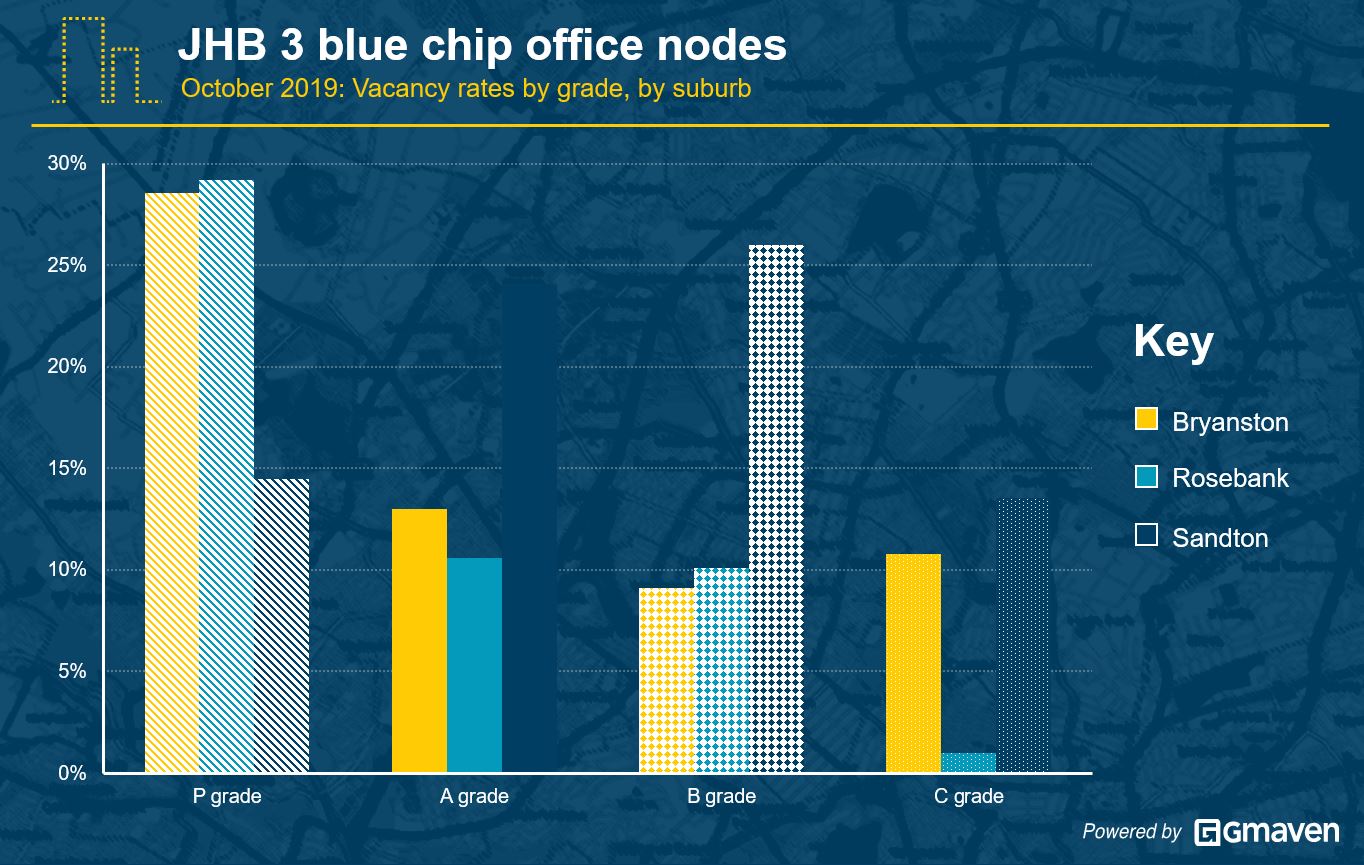
How are those vacancies made up? (Grade by %s)

This is more insightful, but needs to be viewed in conjunction with above for context. It answers the question: which grades are not performing per node…

To let asking rentals by grade

Rosebank, right now, has an oversupply of P grade office. While Bryanston’s P grade vacancy is high, in real terms it’s only 12.0K m². At 14.5%, Sandton’s P grade vacancy is comparatively low – roughly half of the others..

Sandton’s A and B grade vacancies are running at 24.1% and 26.0% respectively. A and B grade space accounts for 44% and 22% of total Sandton vacant area, so these values are not insignificant. However the product is priced to move.

Compared to Sandton, Rosebank and Bryanston A and B grade office is around half as vacant.

For analysis purposes, C grade office can be ignored across the board – the vacant total areas are inconsequential.

This is a straight totals comparison (no vacancy rates). According to the above chart, Rosebank has a lot of P grade space available (55,721 m², or 56% of total), while a higher chunk (29,466 m², or 34%) of Bryanston’s (proportionately lower) vacancies is made up of B grade space.

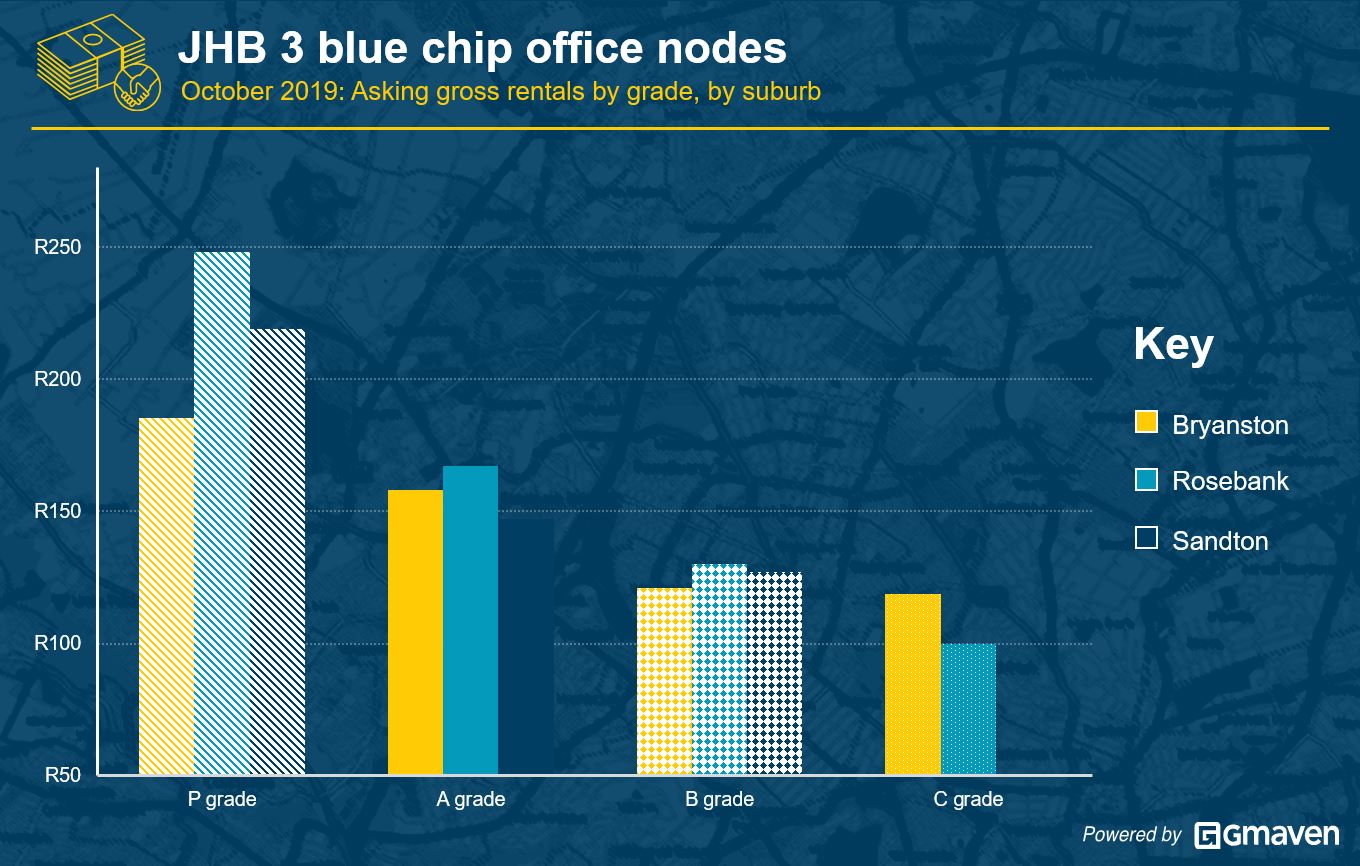
Asking blue chip office gross rentals by grade, by node

Which nodes are able to ask premium rentals, and which nodes are seeing good deals for tenants?

Asking office rentals by grade CRE

The traffic-friendly Rosebank location, as a high density, mixed-use CBD, with good transport access, is leading the charge for all space B grade and upward.

The decentralised office node of Bryanston, at R185 / m² gross asking rentals, is serving the greatest value for its relatively scarce P grade space.

Sandton, with its A grade vacancies of 179.7K m² contributing to 30% of all vacancies across all the above nodes, is priced to let at R147 / m².

B grade office, which accounts for 23% of total space across the nodes (A grade is highest at 41%, followed by P grade at 35%), is fairly consistent across between all areas.

C grade’s vacancies is so inconsequential, it can be ignored.

So, with us now tracking owner categories for these blue chip office nodes – what is the….

Performance of each node by owner type?

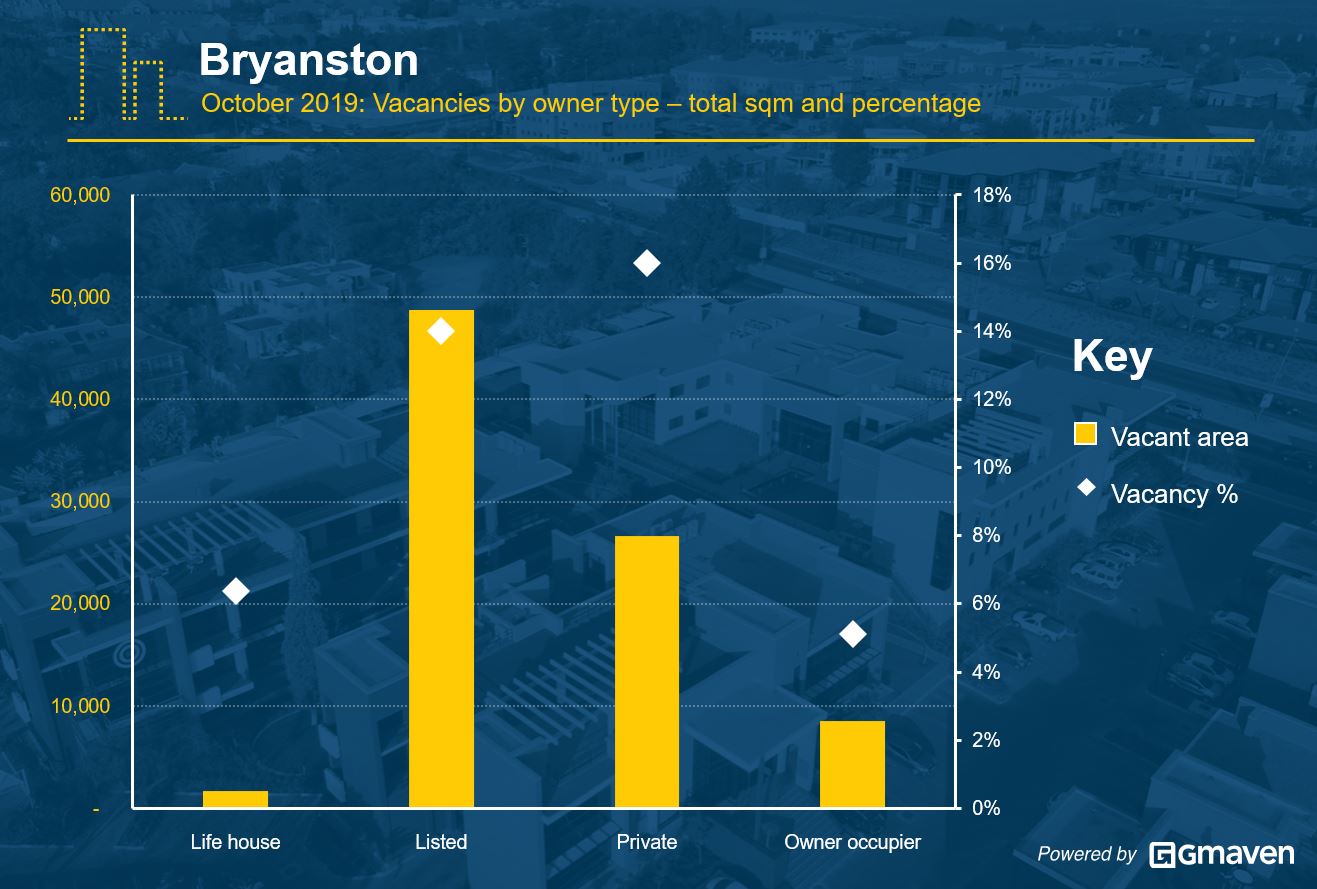
Bryanston commercial property vacancies by owner type

Here the most vacant owner categories are: private at 16%, listed at 14%, life house at 6% and owner occupier at 5%.

Why is life house penetration under weight? Bryanston’s lower zoning means that properties are generally lower-valued – such assets are not traditionally attractive to life houses.

The big bulk of vacancies are: listed funds at 48.8K m², followed by private at 26.6K m², then owner-occupier at 8.5K m².

Private’s high vacancy rate is unusual. It is explained by major tenants relocating from the Bryanston the node, and tenant failures. 76% of private vacancies sit in the hands of four property owners, and straddles just seven properties.

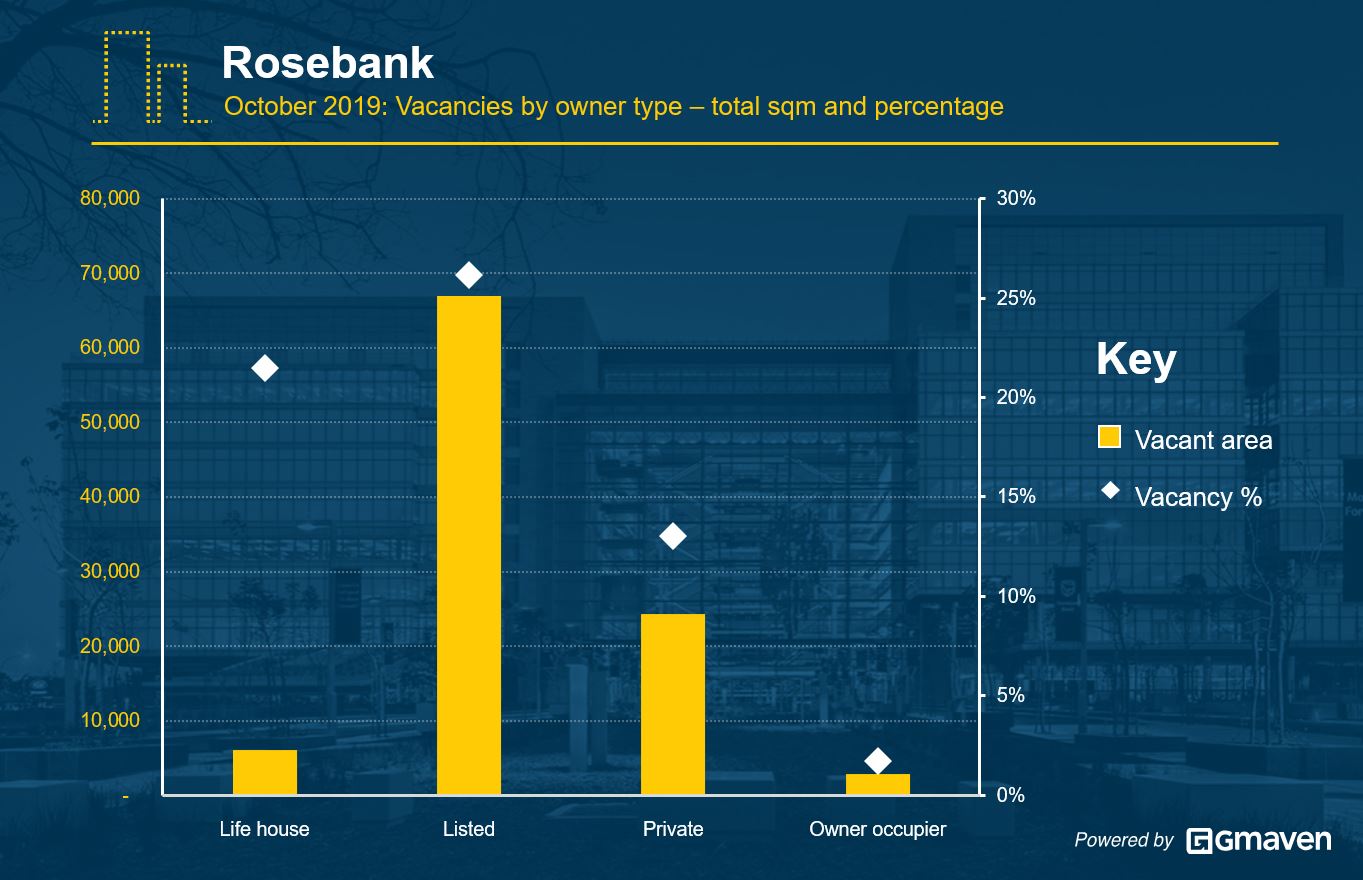
Rosebank office to let by owner CRE

The big contributors to Rosebank vacancies, at 66.9K m² and 24.4K m² respectively, are the listed and private players.

The listed stock overhang of 26% is largely due to on risk developments. Various significant leasing deals underway, if successfully concluded, will assist in taking up this excess space.

Sandton office to let by owner CRE

Sandton’s vacancies are vanilla. Yes, lots of vacant listed and life house space (205.1K m² and 86.5K m², at 23% and 26% respectively), but all in line with expectations.

For more information, please see this article: link

Notes

¹ Wide and narrow definitions

For starters, academically, no definition is right or wrong. However, for us at Gmaven, what is critical is that data is stored in a way that allows various space definitions to be applied. So data can be processed according to each definition.

Why should we care? A short context-providing preamble

Imagine there was a landlord, let’s call her Landlord A, who owned a property in a large node, with one of her properties being the only defined vacancy in the node. This pocket, made up of say 3,000 m², sub-divisible down to 500 m², was available immediately. However, despite this, Landlord A was not able to let that space. And, inexplicably, in parallel, every quarter Landlord A heard that deals, ranging between 500 m² and 3,000 m², were being done in the node. But, not with her. Yet she is the only vacancy. How? And why?

Sound reasons exist. Those tenants in signed leasing deals were instead going to any of one of the following:

  • Space that is not available immediately (like hers), but instead is becoming available in say 2 weeks or 2 months, or
  • Space that is available for sub-lease (vs available to let directly by the owner), or
  • Space falling slightly outside a geographical definition of the node

These 3 factors explain why the landlord’s space is not being leased. The landlord is actually operating in a more competitive market, and the “wider” definition supports this more competitive reality.

Gmaven’s vacancies definition

Gmaven’s vacancies definition may be deemed to be wider, expanding its filter for the following:

  • Space available beyond immediate, extending up to 3 months from now
  • Shadow space (i.e. sub-leases)
  • Gmaven’s geographical definition of Rosebank is as per above

(Gmaven also includes a tiny fraction of “complex space” where its definition / categorisation according to vacancy schedules is unclear (i.e. either it could be deemed to be “rent-attracting supplementary space”, or conventional gross lettable area))

About the author

Related posts

Solar for CRE
Industry Intel and News
Solar for commercial real estate

For a South African CRE industry buffeted by Covid, weak economic growth and public sector incompetence, is solar power too good to be true? Is solar indeed one of property’s unicorns – a positively geared investment with increasing cash flows – and what are the risks associated with it?

Automate CRE data work
Industry Intel and News
CRE data: outsourced

Apple, one of the most profitable businesses in the world, is the king of outsourcing. Its brains reside in California, while its grunt work is spread to specialists all over the world. Is CRE missing a trick? Like the strategic minds at Apple, can it farm back office services to cheaper, specialist hands – and drive greater profitability?

Black Pepper Properties commercial property
Industry Intel and News
White paper: the professional CRE brokerage of tomorrow

What is the role of early adopters in our CRE industry? What characterises these individuals, and how can they help me? Simon Black MRICS, an experienced professional, is one of these. Always seeking the latest tools and innovation, clients can trust them to apply best practices, while the industry follows their lead.

1 Comment. Leave new

Leave a Reply

Your email address will not be published. Required fields are marked *

Fill out this field
Fill out this field
Please enter a valid email address.
You need to agree with the terms to proceed