Who owns blue chip office in Johannesburg?

This article focuses, for the first time, on ownership of South Africa’s blue chip offices (in late 2019). We define property owner categories, then drill down into fresh new stats, broken up by owner type, such as vacancy rates and owned GLA. This fresh approach hopefully helps you efficiently see the world through a slightly different lense.
Commercial property ownership office

This is a first attempt in South Africa of answering the question: “who do these buildings in prestige office nodes belong to?”

“One man’s meat, is another man’s poison”

Lucretius, Roman poet, first century BC (more detail on this quote is here)

Unlike residential, commercial real estate (CRE), the “premier league” of property, is a non-homogenous asset class. Properties are broken up by property category, sub-categories within categories, grades, and area. As a result, property owners compete with a diverse range of skills. Thus, what may be attractive to certain property owners, is not attractive to others.

Context

Our sample set, comprises 3 “blue chip” office nodes within JHB ¹.

These are the nodes we analysed:

<– Bryanston’s definition and some high level info is here

<– Rosebank’s definition and some high level info is here

<– Sandton’s definition and some high level info is here

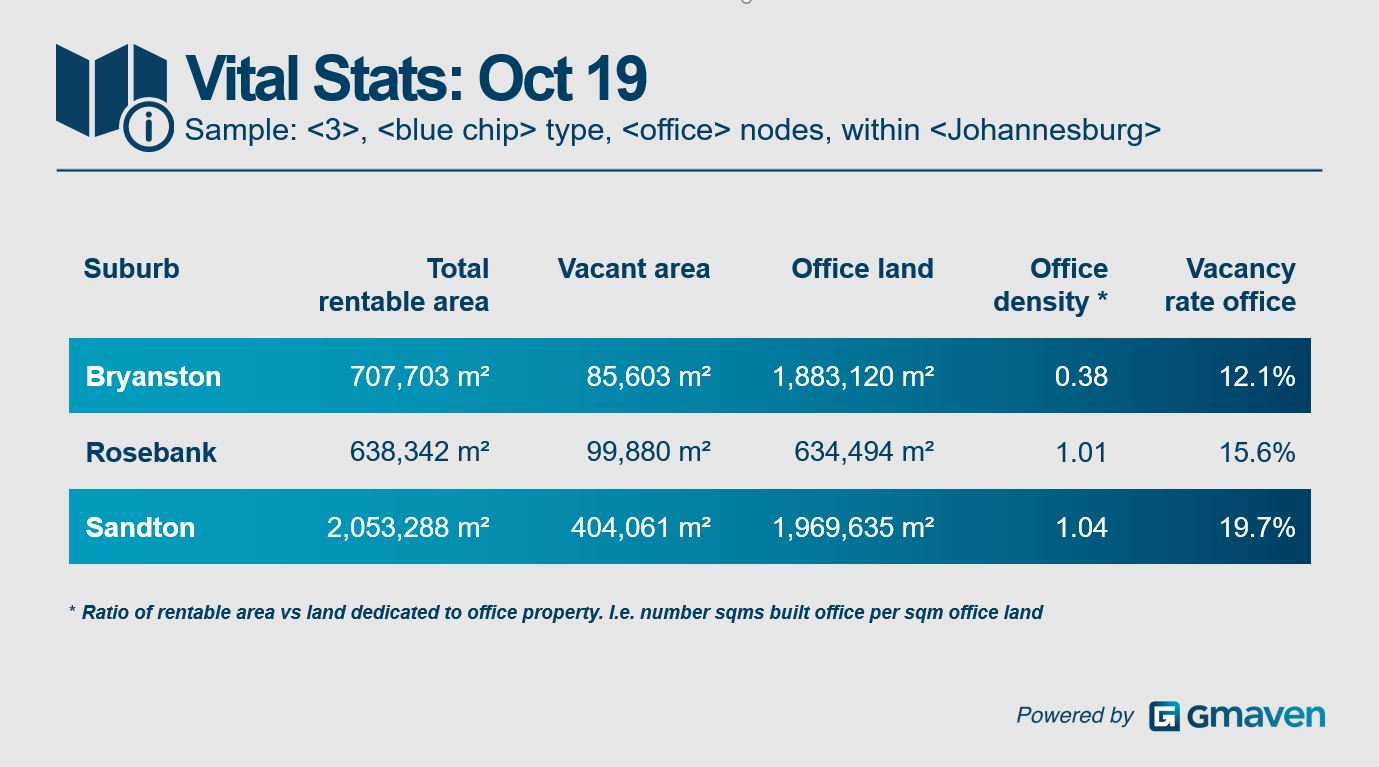
Here are some “vital stats” on the nodes for you:

Research CRE office to let

Sandton’s total built area, at almost three times their size, dwarfs that of the other nodes.

Bryanston’s office development is roughly only one third as dense – and this suburb, unlike Rosebank and Sandton, is deprived of access to rail transport.

Rosebank, with its historic high density residential (and a flurry of new resi developments), is, right now, relative to Sandton and Bryanston, the closest to a “mixed use” node.

If you’re interested, more information on the relative performance of these nodes is over here:

What do owner categories mean?

Firstly, here is some clarity on property owner categories (note – property owners are different to property managers). All of the players below invest directly in the property assets in question. In other words, either directly, or through legal entities they control, they own the properties outright.

  • Listed = Growthpoint, Redefine, Fortress, Emira etc. To clarify, a company with shares that are publicly tradeable.
  • Private = Barrow, Zenprop, Alchemy, Intaprop, Atterbury etc. That is, private companies where shares are not publicly tradeable.
  • Life house = MMI (resulting from the merger of Momentum and Metropolitan), Sanlam, Liberty, the PIC etc. While life houses can and do invest indirectly in CRE (for example investments in the listed property businesses above), in this instance the pension funds / major financial product players are direct investors in CRE.
  • Owner occupiers = Total, Nedbank, RMB, Netcare etc. Where an occupier / tenant of a property also owns the property.

The ownership data

Blue chip commercial property ownership

What would we expect? And what do we see?

Traditionally, in industrial nodes, owner occupiers represent the highest share of ownership…

Meanwhile, in non “blue chip” / traditional investor-attractive nodes, one would anticipate lower penetration of life houses and listed owners.

Within these 3 office nodes under review, owner occupiers account for under a quarter of total built area.

Listed players are clearly the dominant owners, having succeeded in acquiring the bulk of real estate in these nodes.

Life houses have seen direct property ownership fall due to bulk disposals in the late 1990s, and subsequent asset ratio-driven sell-downs in the late 2000s.

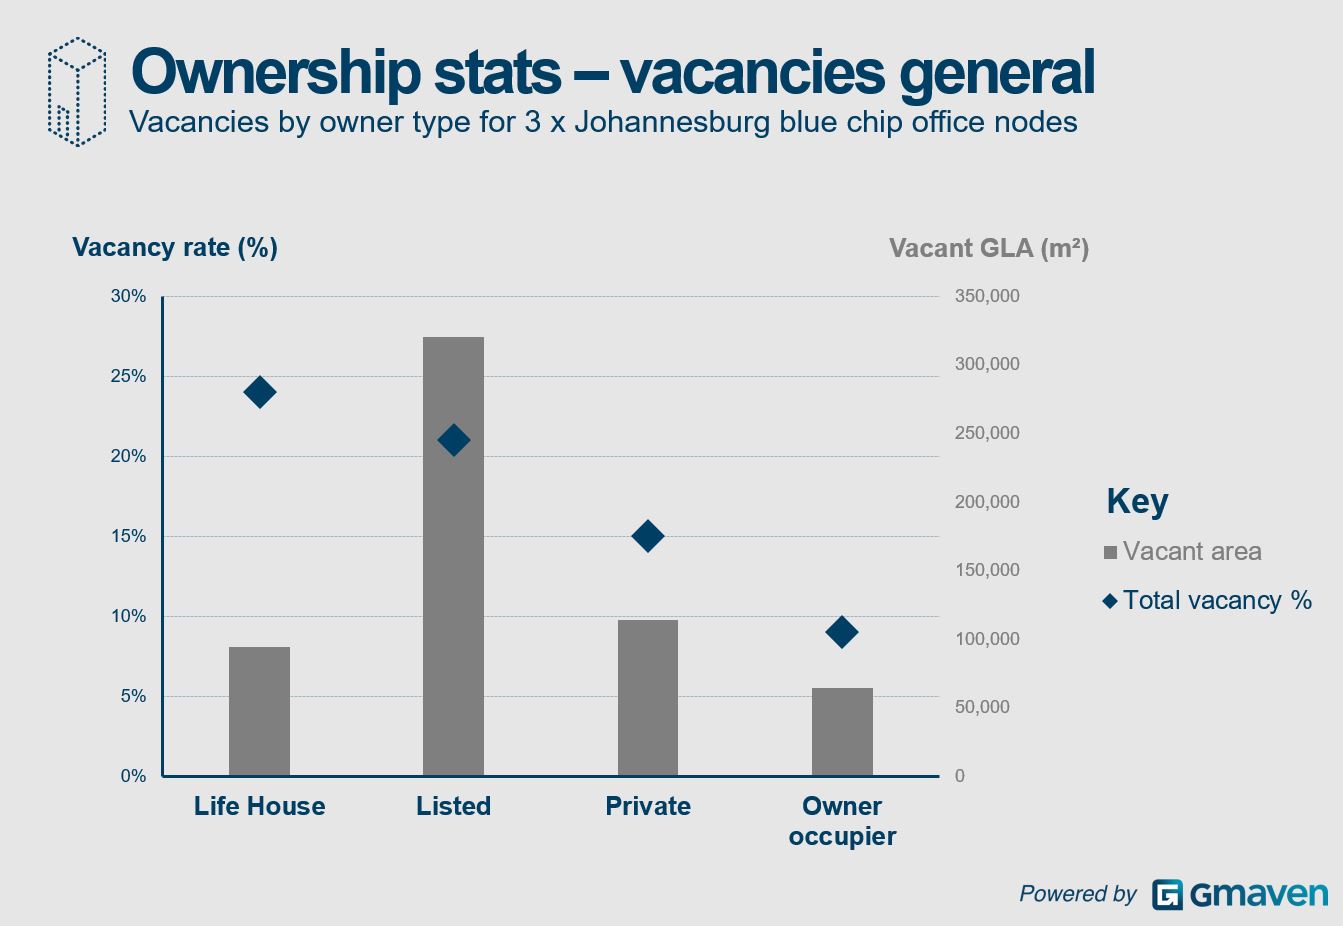
At a high level, this is how the owner categories are performing across all nodes:

Office to let by owner commercial property

Relative to all other categories, private players are highly nimble and “hands on”. Generally area specialists, with high access to data, they have greater equity incentives to perform. Private players, generally, have constrained access to patient capital, and are thus risk averse and short term orientated. Therefore it is unusual for such players, to build “on risk” – i.e. to develop without a tenant lease to fund the development. This is reflected in private players’ low levels of vacancy. However, for this agility, private property funds pay a price. If / when economic conditions improve, quickly, their upside is capped.

Life houses are generally owners of “trophy properties”. Properties which require high levels of investment and a longer-term view, but which represent irreplaceable real estate assets. To satisfy conventional risk criteria, their portfolios are generally spread across geographies and property categories. Generally, life houses acquire high quality assets with long-dated leases from either private players or owner occupiers on sale and leaseback deals. In most instances, the management of properties owned by life houses is outsourced to specialist property managers.

Incidentally, life houses can, for certain properties, also “wear the hat of” owner occupiers. It’s hard to beat the covenant of your own balance sheet!

How property owner categories are performing by grade?

CRE research office vacancies by owner by grade

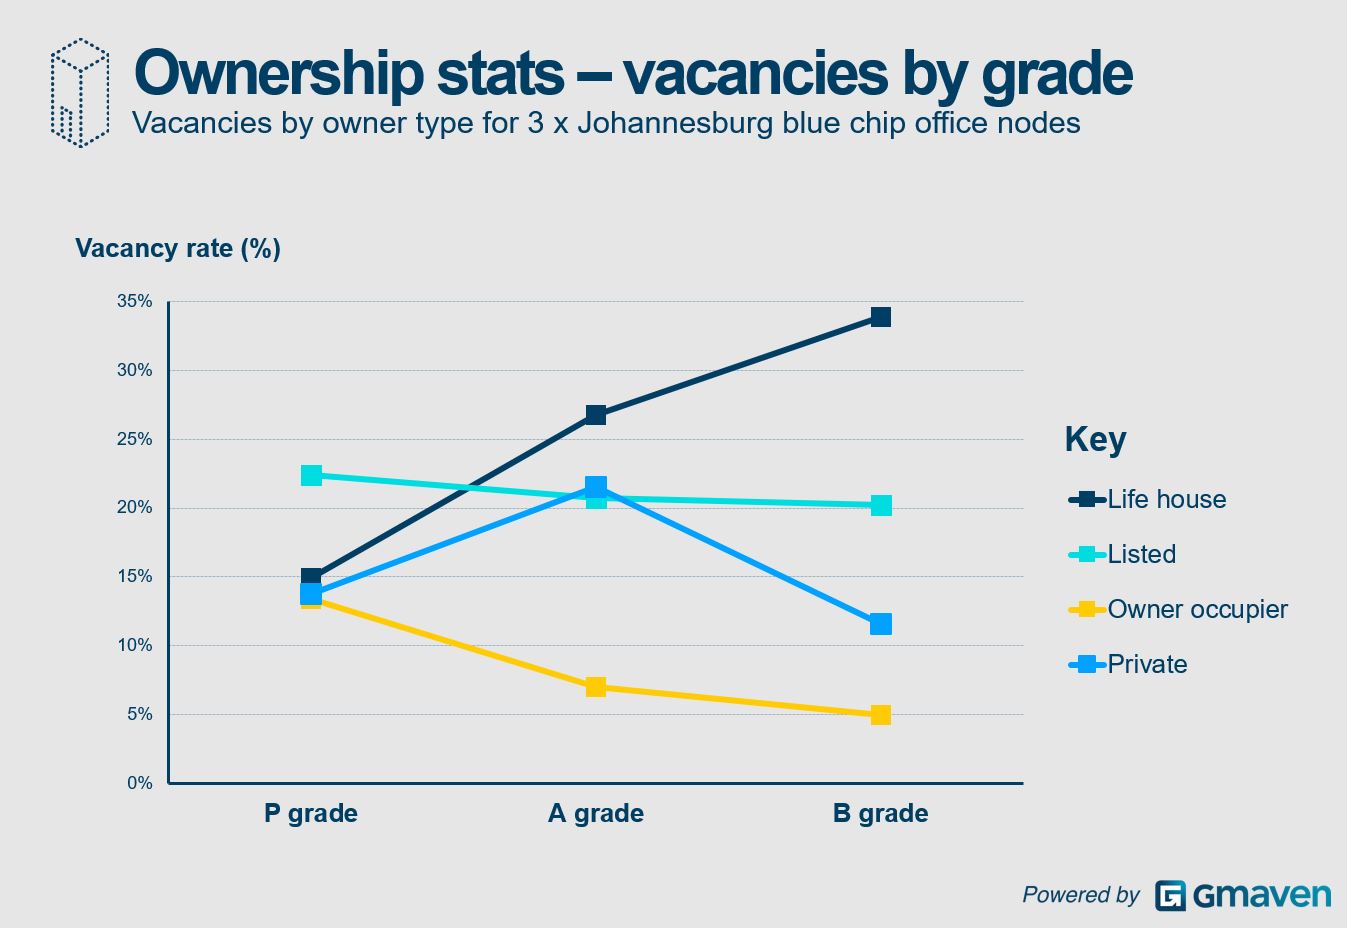
(We are ignoring the tiny fraction of C grade offices owned by these players)

The listed sector’s stable performance talks to scale-orientated businesses that operate consistently across all grades.

A theory here is that lifehouses acquire premium assets with long dated leases. As the asset quality degrades over time and lease duration shortens, the tenants are poached by more aggressive private players who are small and nimble enough to outservice their tenants. This hypothesis can be used to explain the increase in vacancies.

Private is interesting… They will look to limit risk on new builds – this will explain the low vacancies in the P grade space. The uniquely low levels of vacancy / high tenant retention in the B grade segment can be attributed to their hungry and entrepreneurial mindset, and flat-decision making structures. A grade vacancies appear to be at market.

Owner occupier’s low vacancy rates may talk to two drivers:

  • Concealed vacancies / a form of shadow space – instances where businesses may have shrunk, and staff densities are simply lower. In the instance of an upturn in the economy, these properties will have greater flex / easier absorption of new staff
  • Owner occupiers being deprived of access to channels to market their space sub-leasing opportunities. Gmaven has identified this problem and is currently looking to solve or assist this

How property owner categories own by grade?

Blue chip commercial property ownership by grade

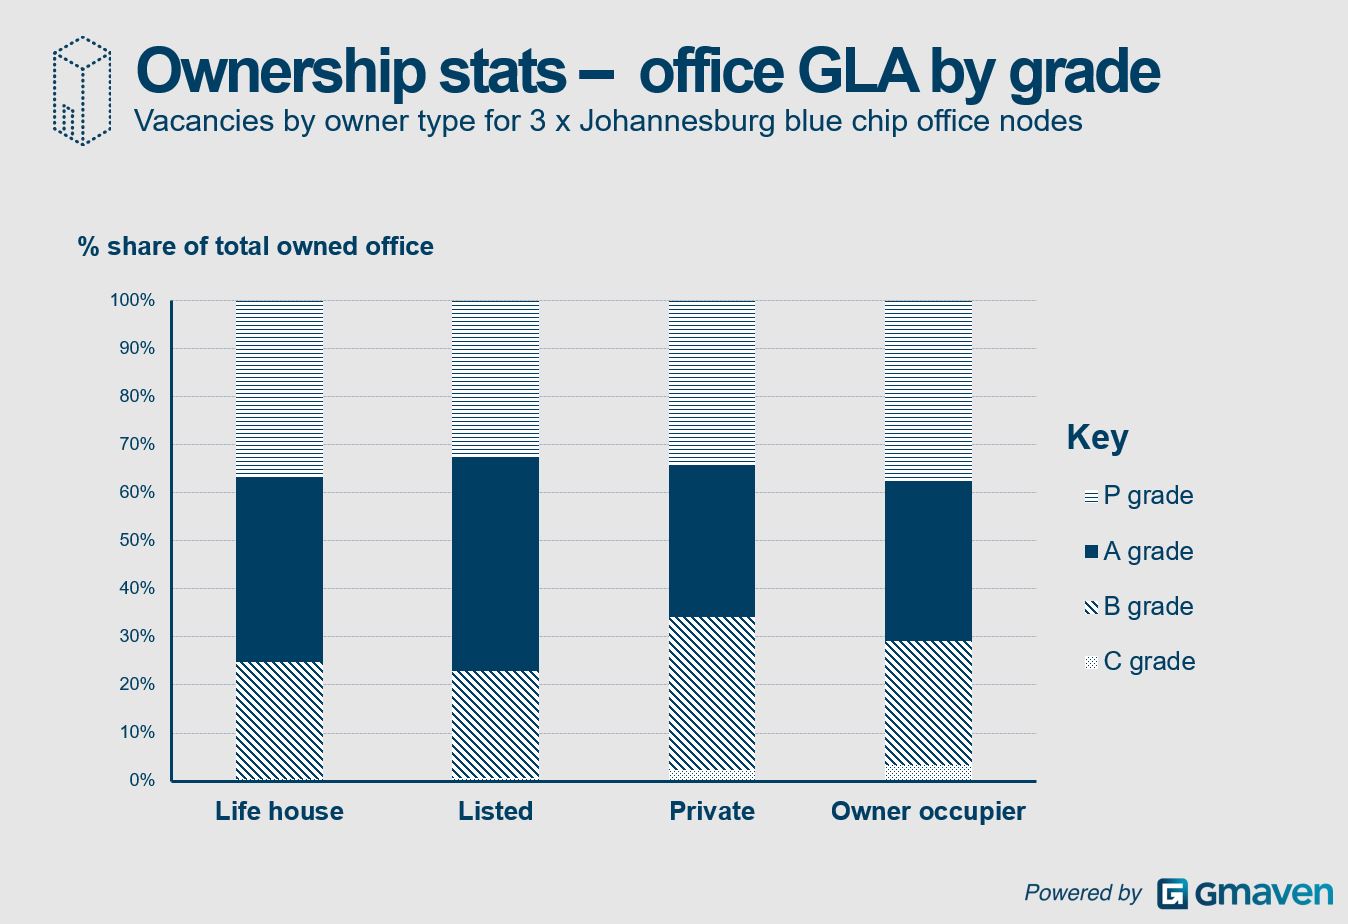
Nothing too remarkable here…

Key take aways – proportionately speaking (for the sample nodes) – blue chip office ownership in Johannesburg, looks like this by grade:

  • Life houses own most P grade office,
  • Listed owns the most A grade, and
  • Private has the biggest share of B grade

Accreditation and thank you

Commercial real estate remains an information-opaque industry. In providing greater understanding and accessibility to this fascinating asst class, it the hope of industry experts and Gmaven that the industry’s reputation will be enhanced, talented individuals will be attracted, and good will be done.

Thank you to the following experts for their support:

  • Niel Harmse of MSCI, for sense-checking certain terms and assisting as a valuable sounding board.
  • Kerry Millar of RealFMG for oversight and “acid testing” of our logic.

We have done our very best to ensure complete accuracy. However, in the instance of omissions or errors, these are all our own.

Notes

¹ Clarification

As the quote above attests to, “blue chip” is a highly subjective term. As industries rise and fall, residential patterns change, transport changes, zoning evolves, nodal activity changes, sectional title /fractional ownership is introduced, and the economy moves – today’s ugly duckling may be tomorrow’s investor darling.

Note: If this exercise captures the interest of SA CRE professionals, we can look at other geographies (e.g. W Cape, KZN), other node types (mature CBDs, decentralised nodes), or other property categories (e.g. industrial).

About the author

Related posts

SA commercial property value
Industry Intel and News
Latest SA commercial property value

This is a key number in South African commercial real estate (CRE). After a lot of hard work, we are able to deliver a firm, defensible value to SA – relevant to businesses (who almost all operate out of CRE), policy makers and the industry itself.

Solar for CRE
Industry Intel and News
Solar for commercial real estate

For a South African CRE industry buffeted by Covid, weak economic growth and public sector incompetence, is solar power too good to be true? Is solar indeed one of property’s unicorns – a positively geared investment with increasing cash flows – and what are the risks associated with it?

Automate CRE data work
Industry Intel and News
CRE data: outsourced

Apple, one of the most profitable businesses in the world, is the king of outsourcing. Its brains reside in California, while its grunt work is spread to specialists all over the world. Is CRE missing a trick? Like the strategic minds at Apple, can it farm back office services to cheaper, specialist hands – and drive greater profitability?

Leave a Reply

Your email address will not be published. Required fields are marked *

Fill out this field
Fill out this field
Please enter a valid email address.
You need to agree with the terms to proceed